
Tandem Cylinders: FW-H Against Literature
validation
Animation of the divergence of the velocity (the dilatation) on a plane through the two cylinders, which shows the sound radiated by the flow around and between them, with isosurfaces of the vortical structures coloured by the velocity magnitude.
Overview
Two circular cylinders of equal diameter, placed in tandem along the freestream direction, shed an unsteady turbulent wake whose surface pressure fluctuations radiate sound. This case solves the flow with detached-eddy simulation and predicts the radiated acoustic pressure at one observer using the solid-surface Ffowcs Williams-Hawkings analogy.
Problem Setup
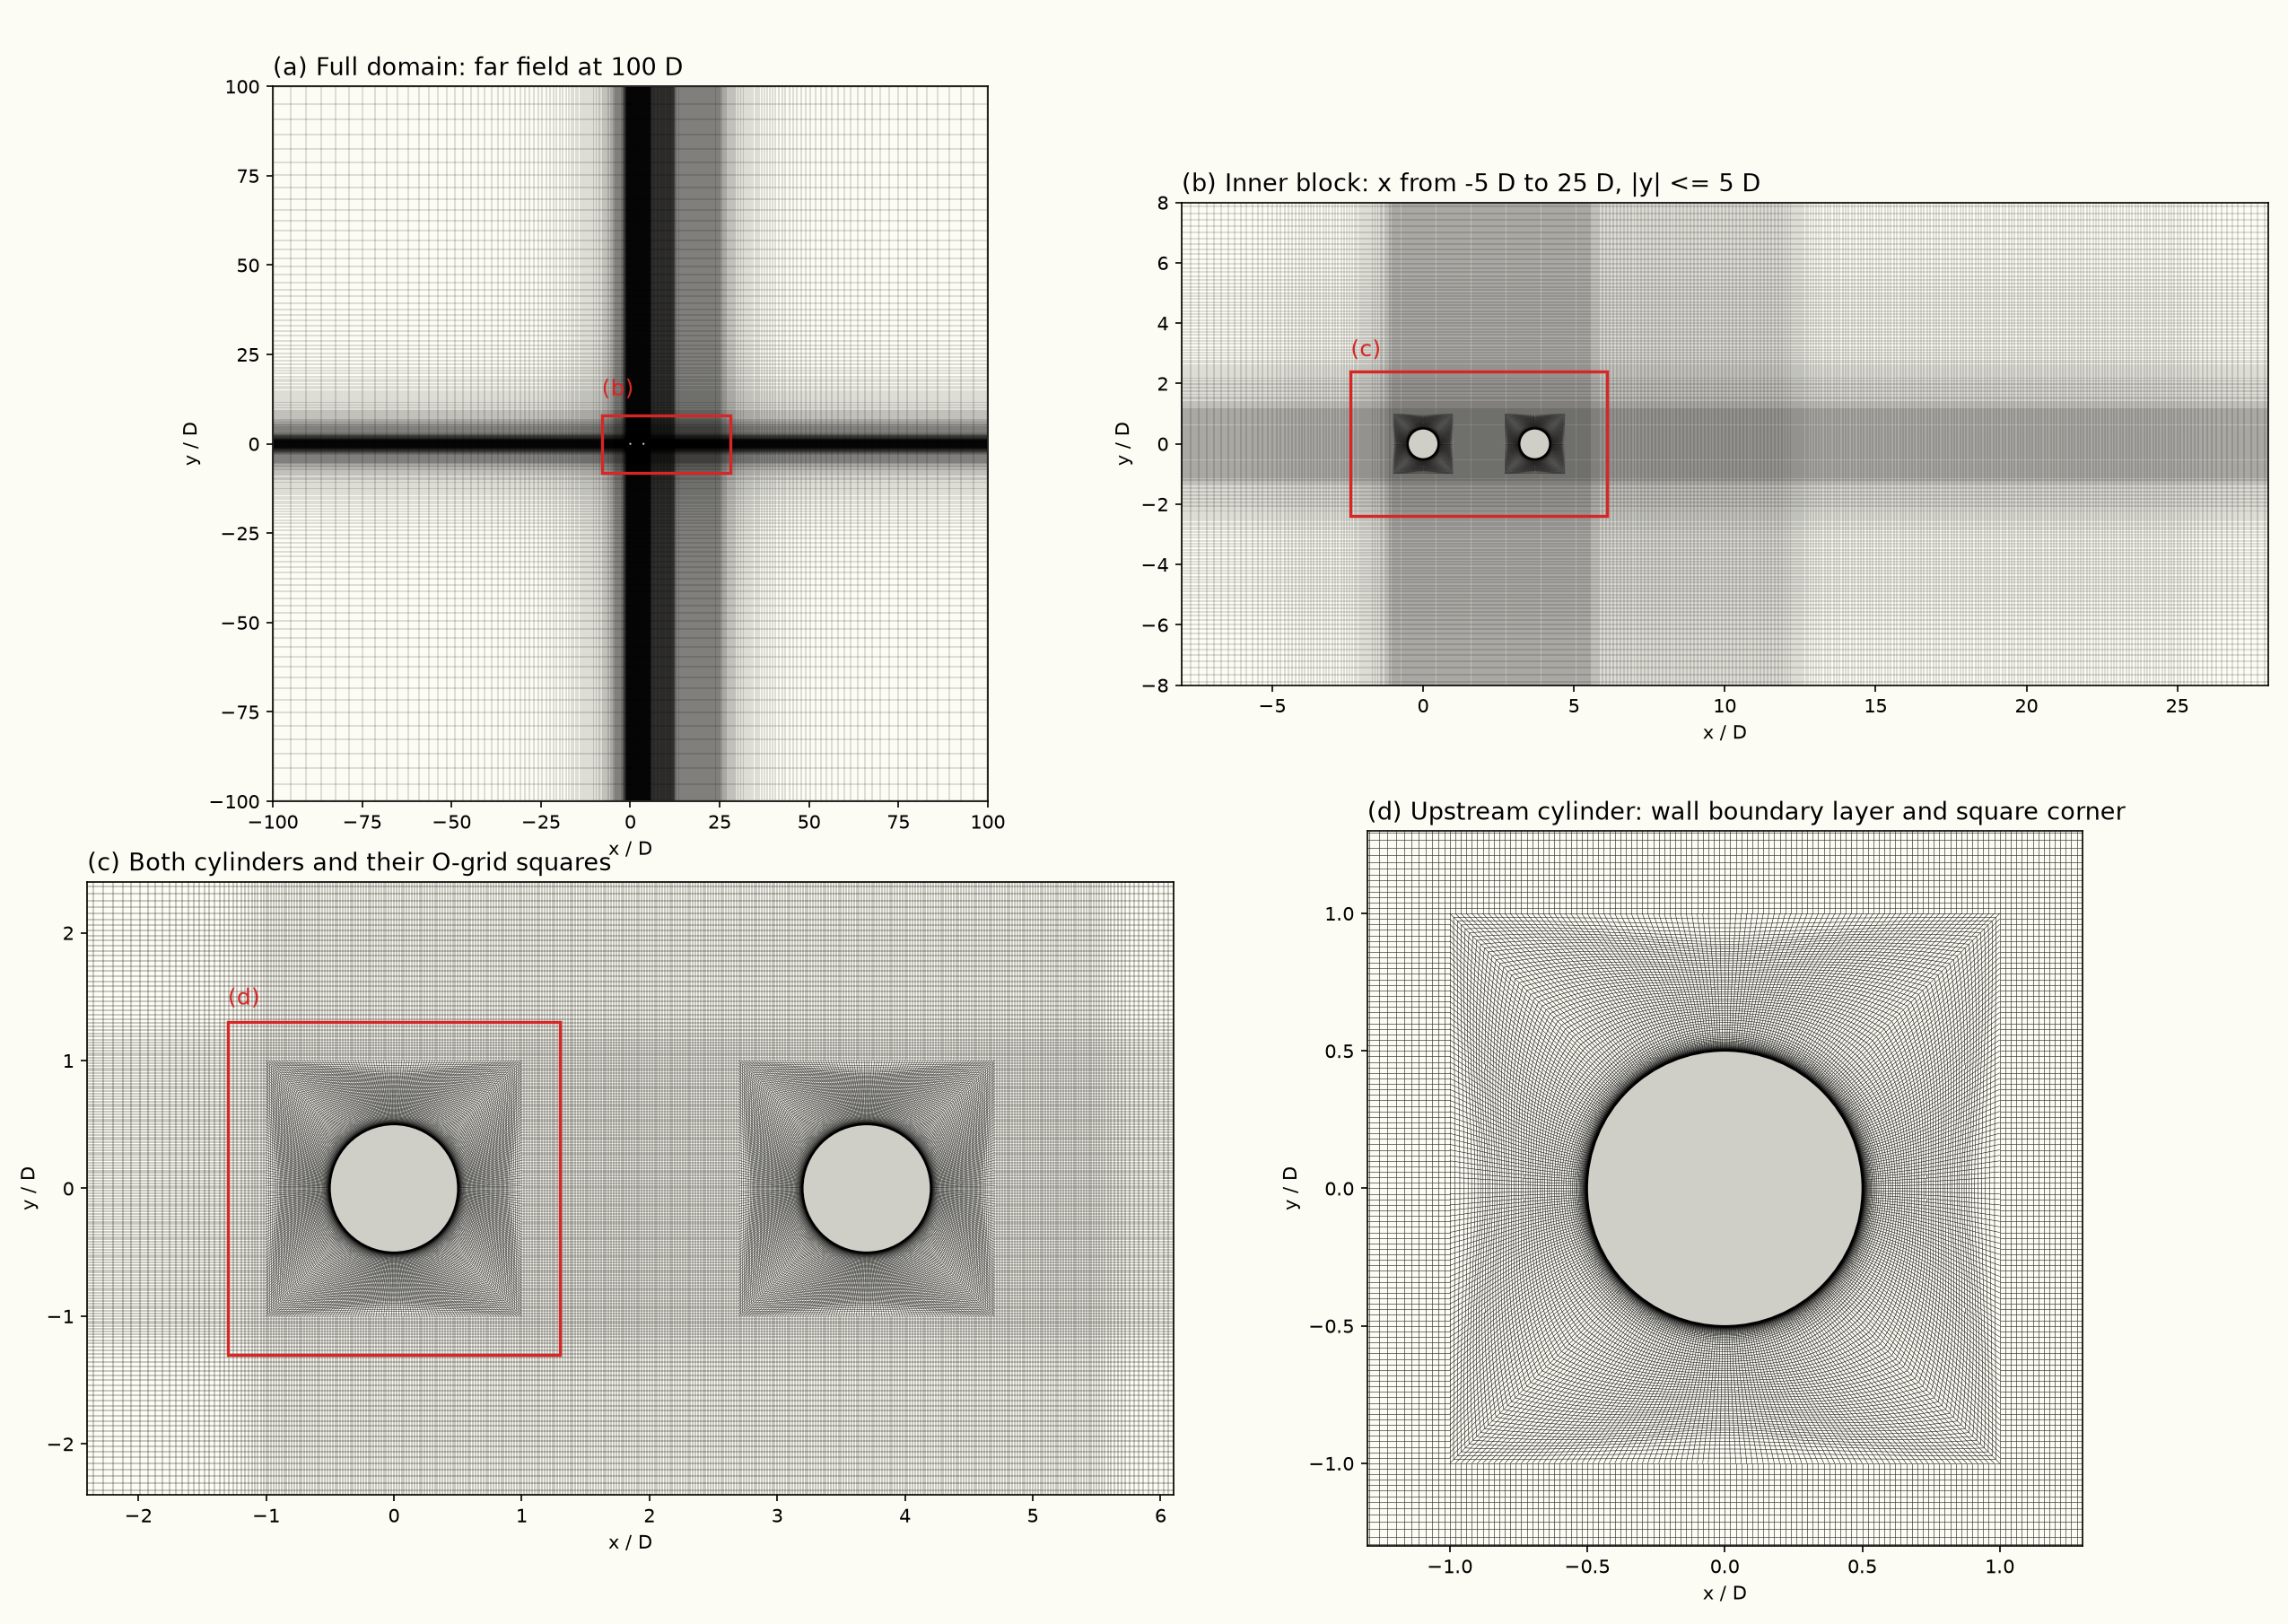
The freestream Mach number is ( m/s, K), with a cylinder diameter m. The domain is periodic in the spanwise direction over , and both cylinder surfaces are no-slip adiabatic walls. The turbulence closure is Spalart-Allmaras delayed detached-eddy simulation, with the FDS convective flux and its hybrid low-dissipation formulation, and second-order implicit time integration at s for 23,600 steps, on a block-structured mesh of 36.8 million hexahedral cells with 96 spanwise layers. A sponge layer that absorbs the outgoing sound starts 1 m from the mesh origin and is 2 m thick. The solid-surface Ffowcs Williams-Hawkings analogy integrates both cylinder walls and records the acoustic pressure at one observer in the mid-span plane, at from the centre of the upstream cylinder. This is a microphone position in the Quiet Flow Facility experiment whose spectrum is shown for comparison.
The experimental cylinders span and the simulated span is , so the simulated spectrum is scaled to a span before the comparison, following Seo and Moon (2007), using how coherent the simulated surface pressure is along the span. Away from the shedding tone the pressure is incoherent beyond a fraction of a diameter, and the scaling adds dB. Near the tone the pressure stays coherent over the whole simulated span, and the scaling approaches the fully coherent dB. The spectrum is averaged over the record from s on, with a frequency resolution of about 12 Hz.
Quantities of Interest
The time-averaged and RMS surface pressure coefficient around both cylinders, the surface pressure spectra at on the upstream cylinder and on the downstream cylinder, and the time-averaged streamwise velocity and two-dimensional turbulence kinetic energy along the centreline in the gap and in the wake, each compared with the measurements and the CFL3D simulation reported by Lockard (2011). The narrowband power spectral density of the acoustic pressure at the observer, compared with the spectrum measured in the Quiet Flow Facility, and the frequency and level of the spectral maximum between 150 and 220 Hz for both.
Sources
Results
Mesh and domain
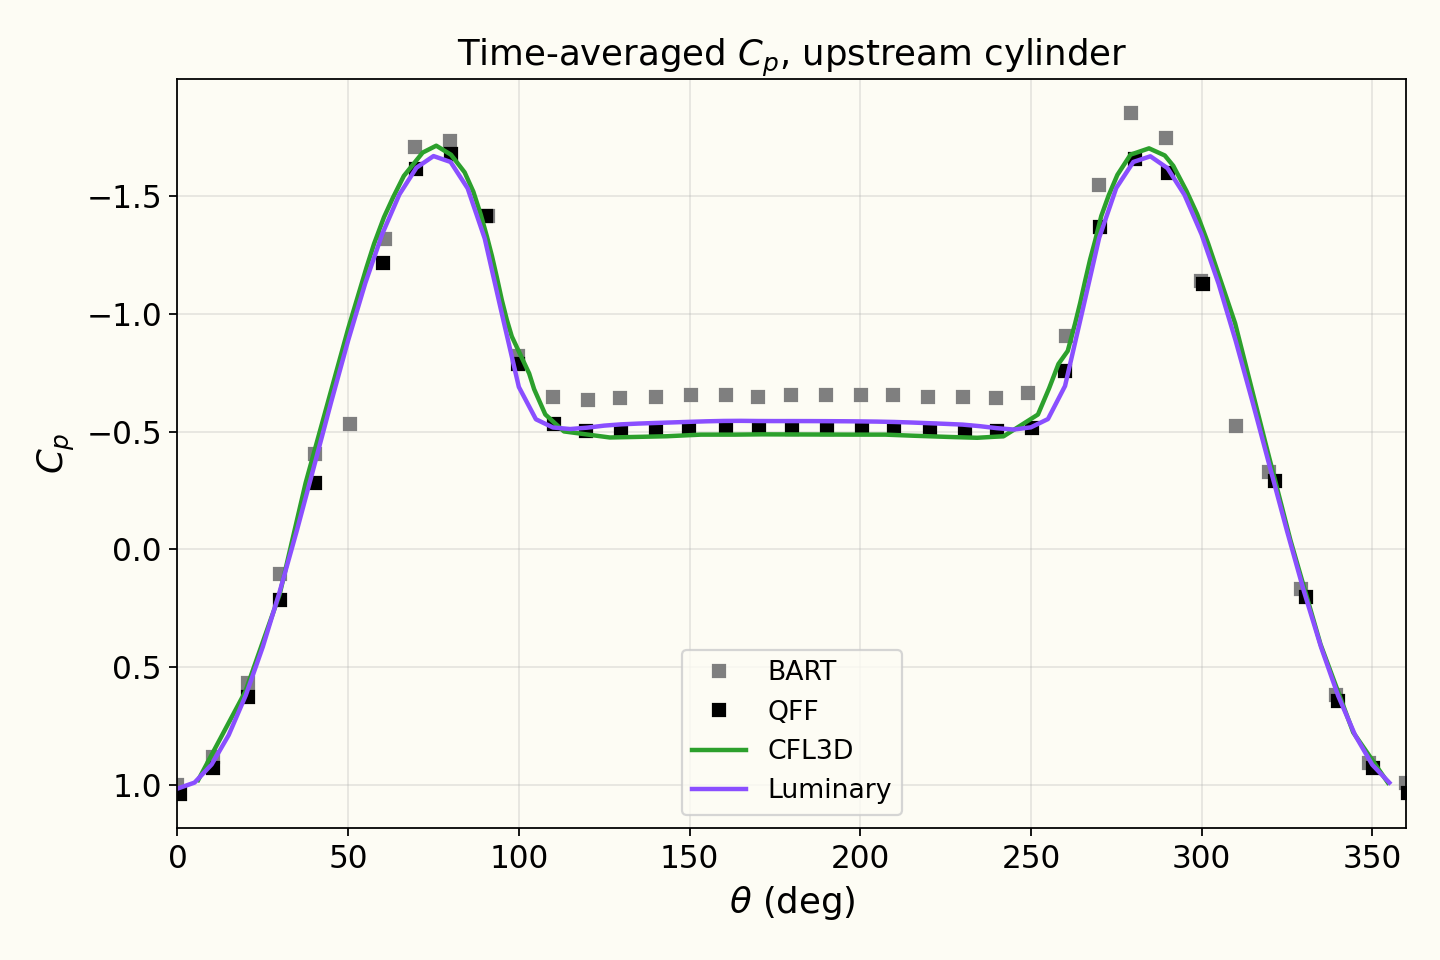
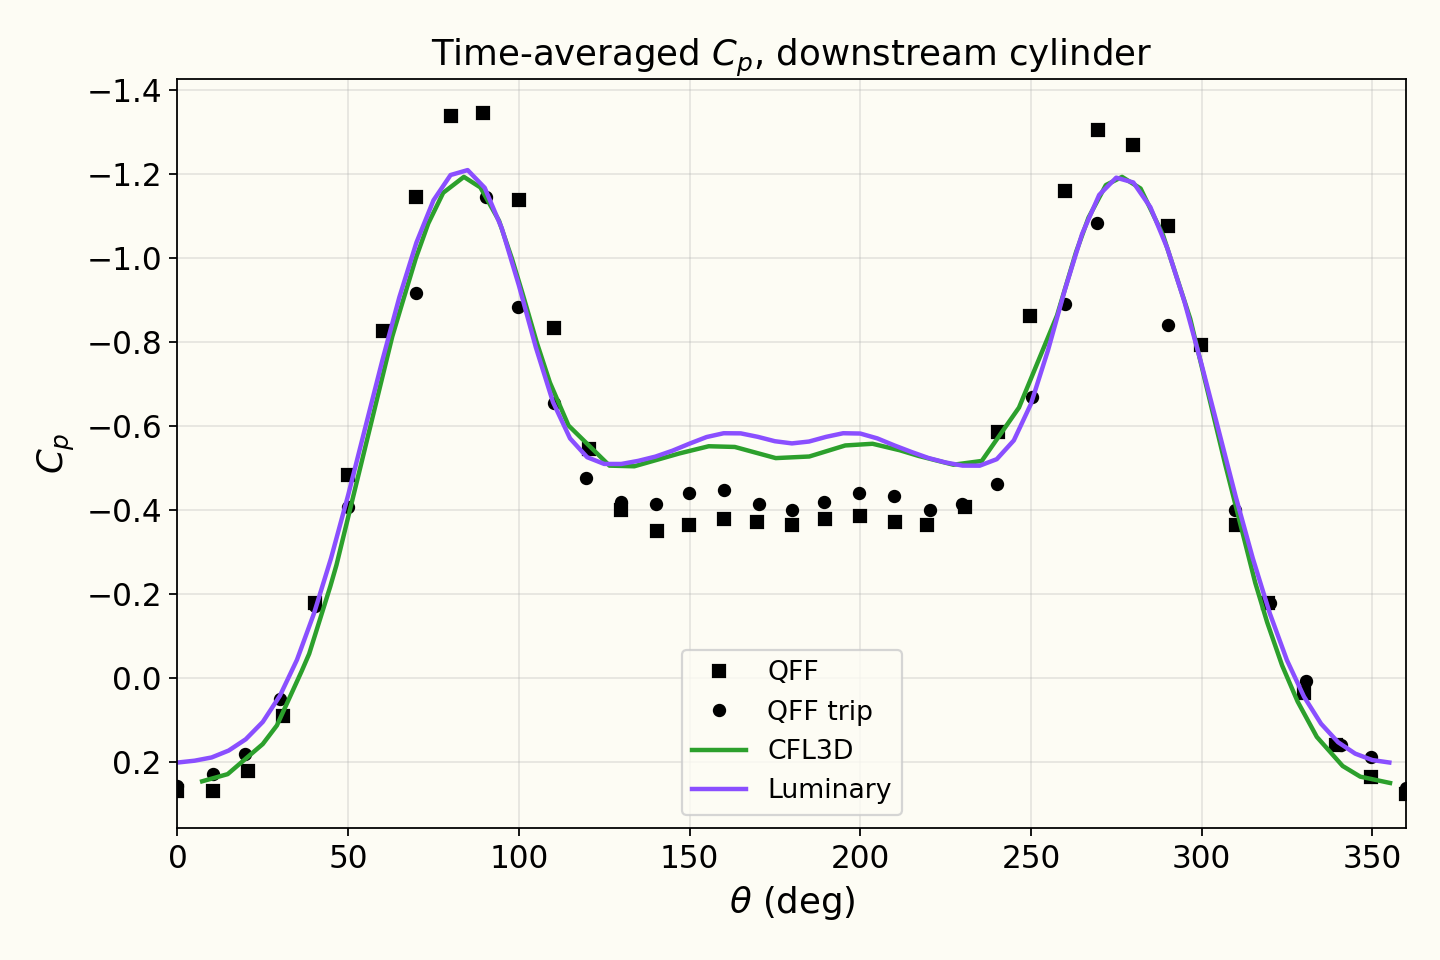
Mean pressure coefficient on the cylinders
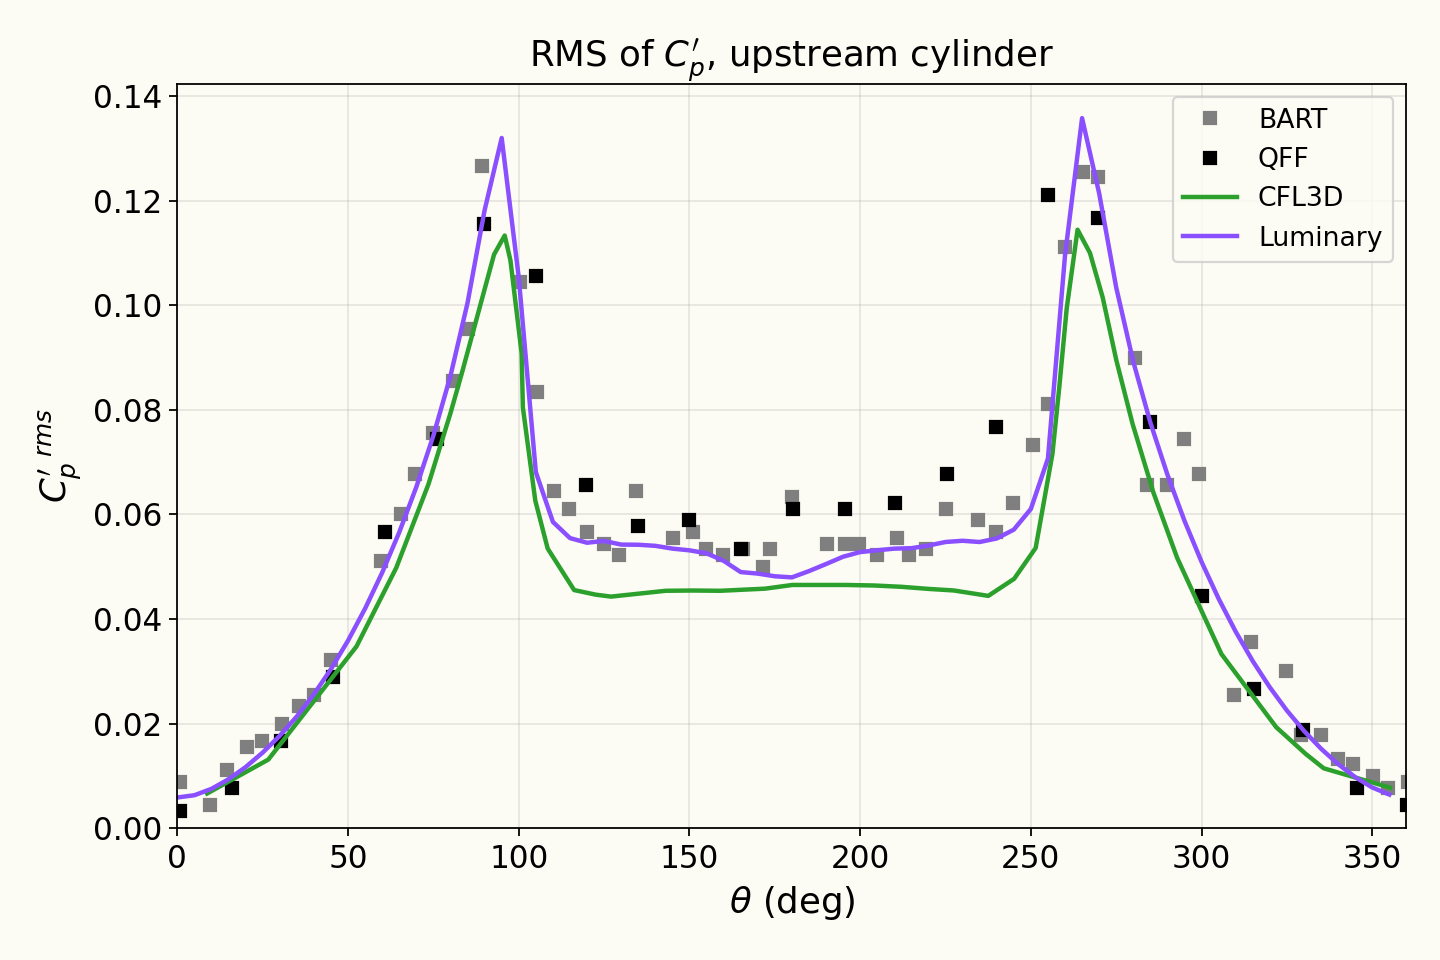
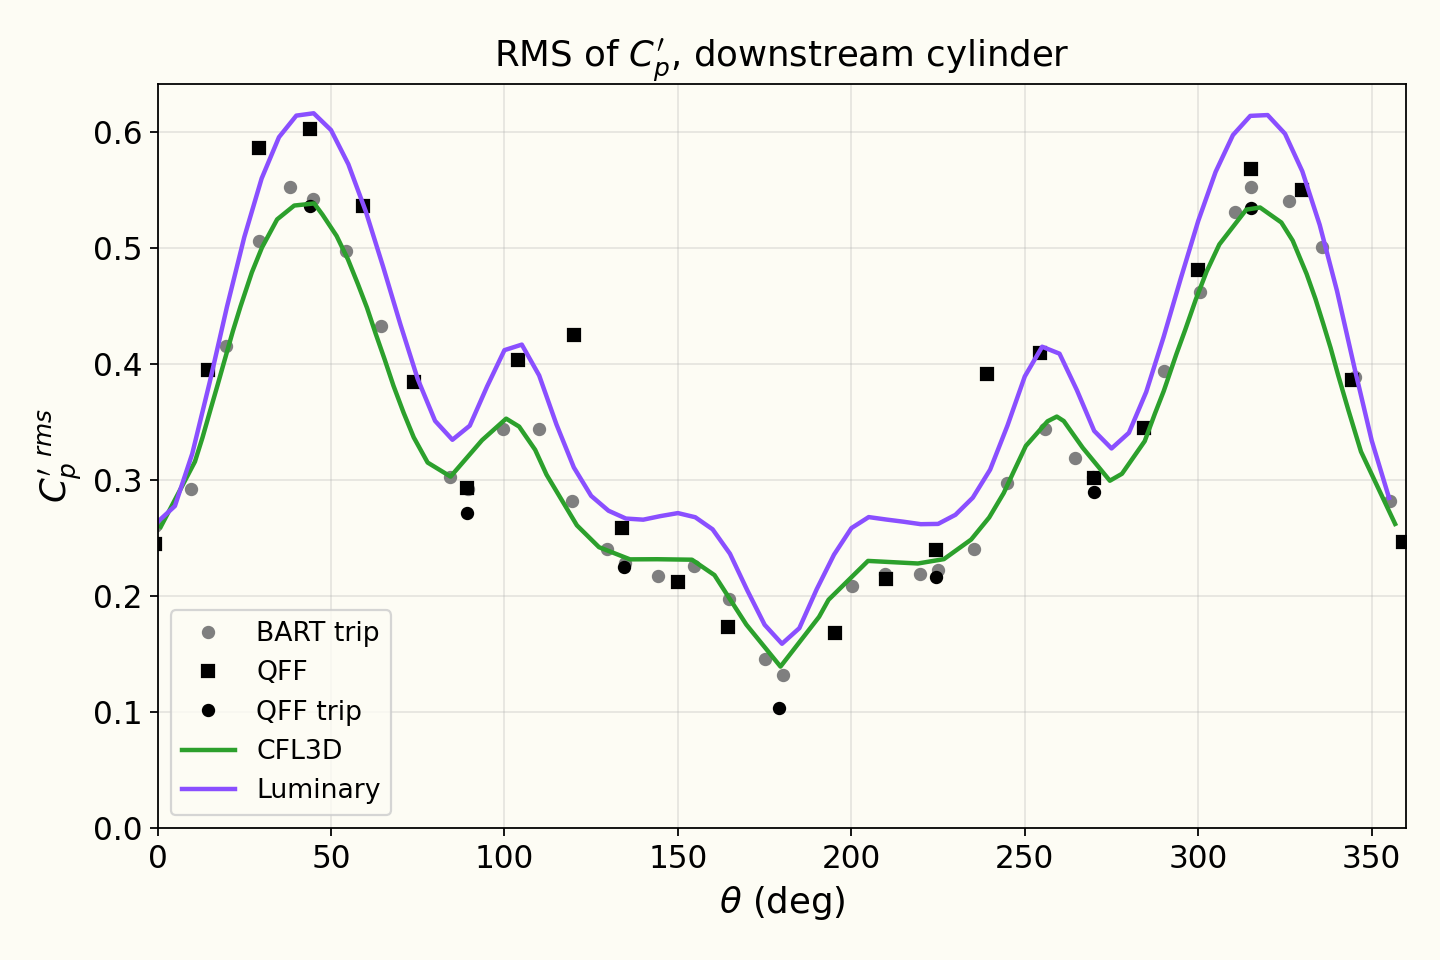
RMS pressure coefficient on the cylinders
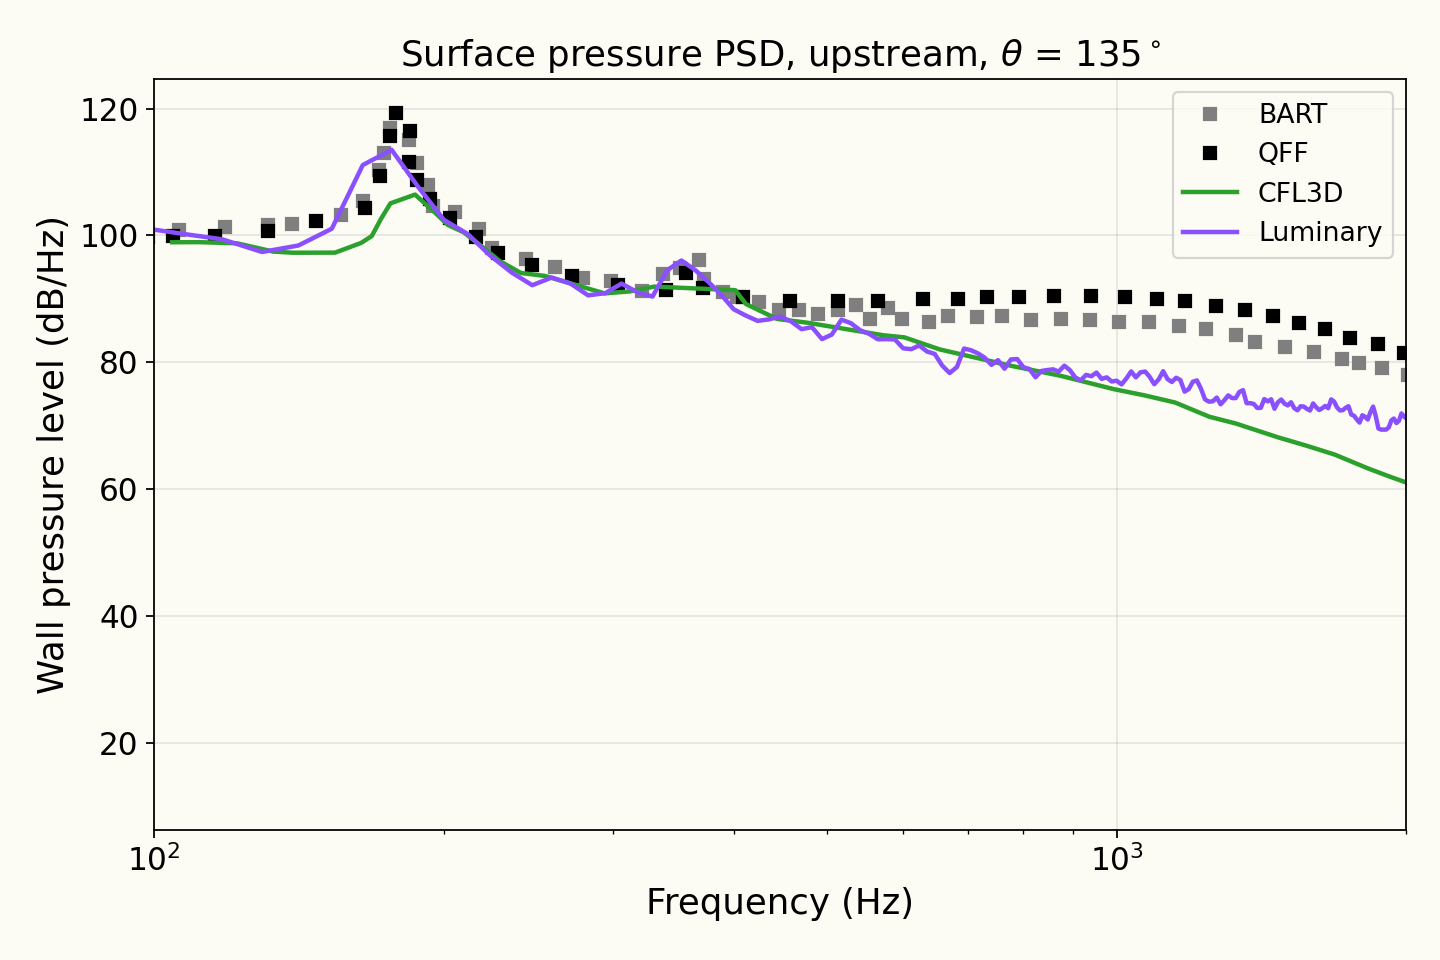
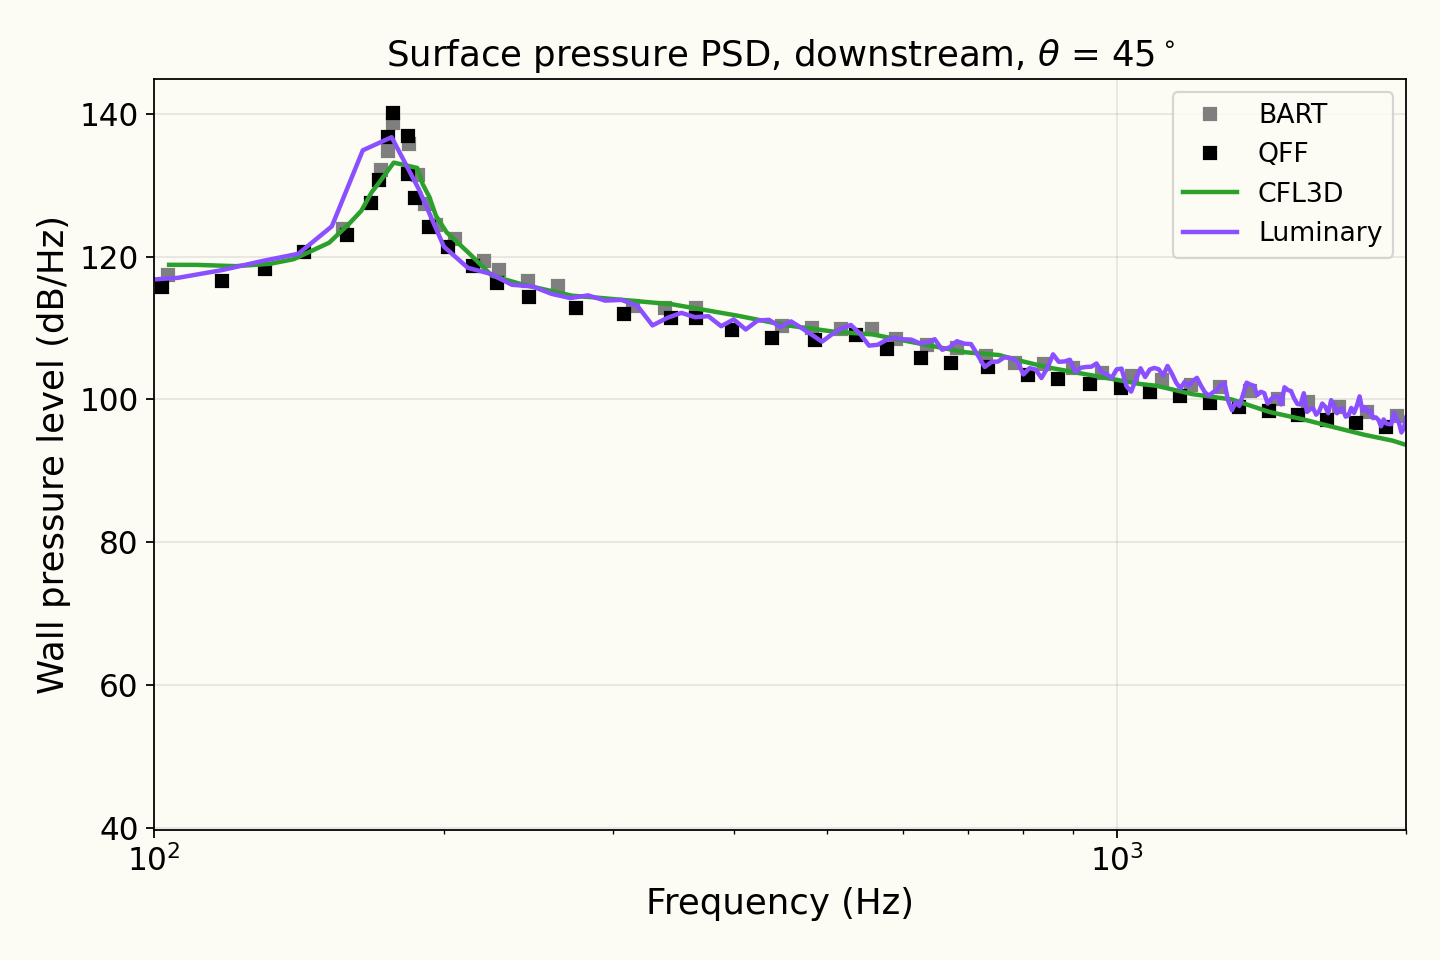
Surface pressure spectra on the cylinders
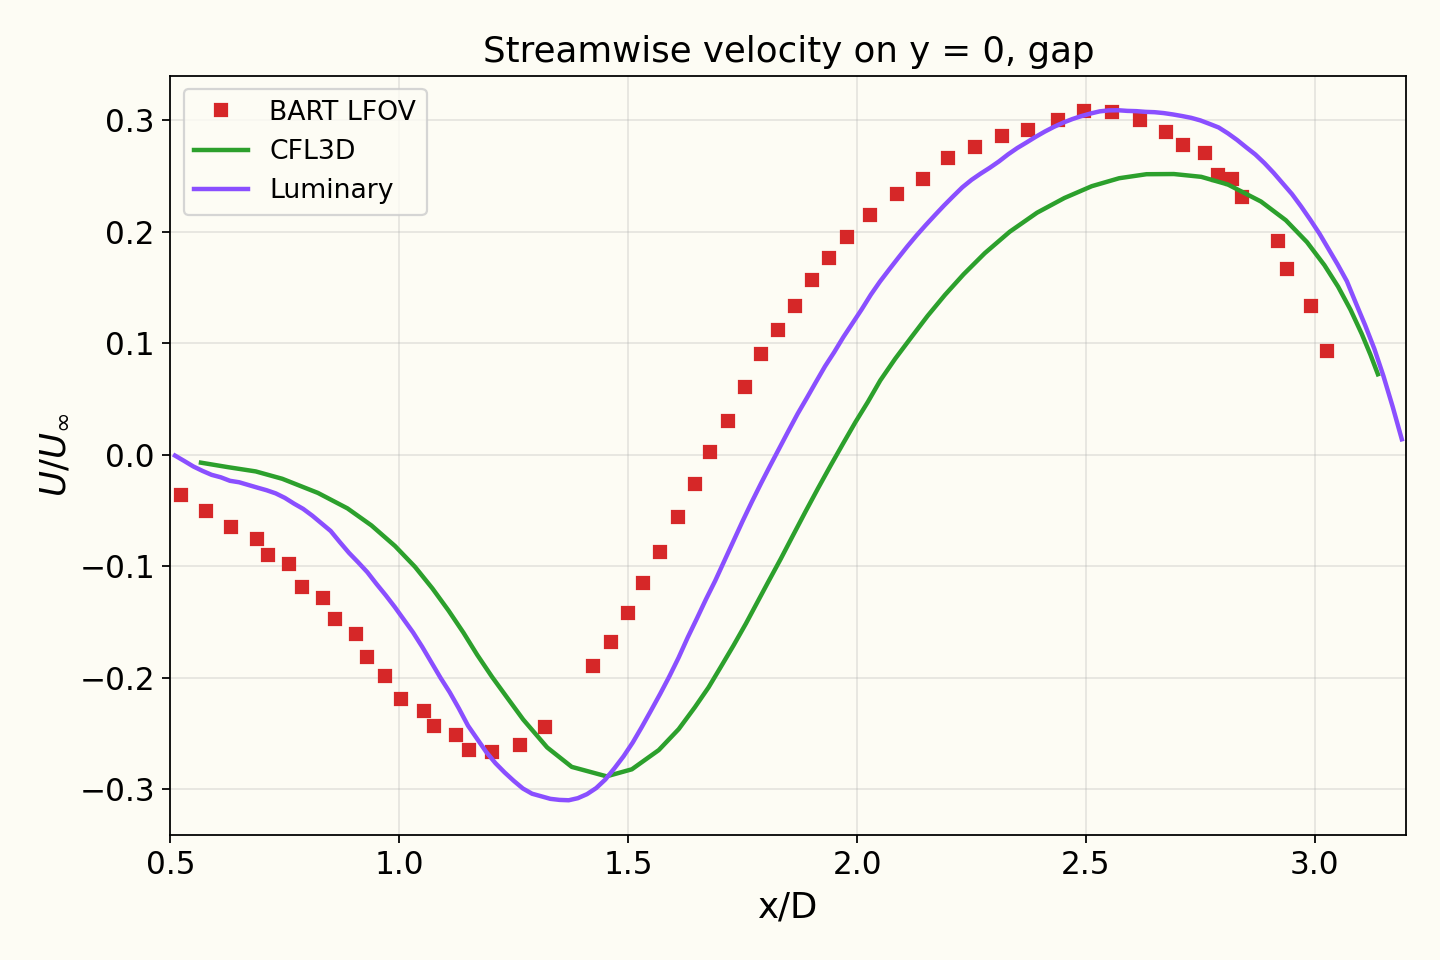
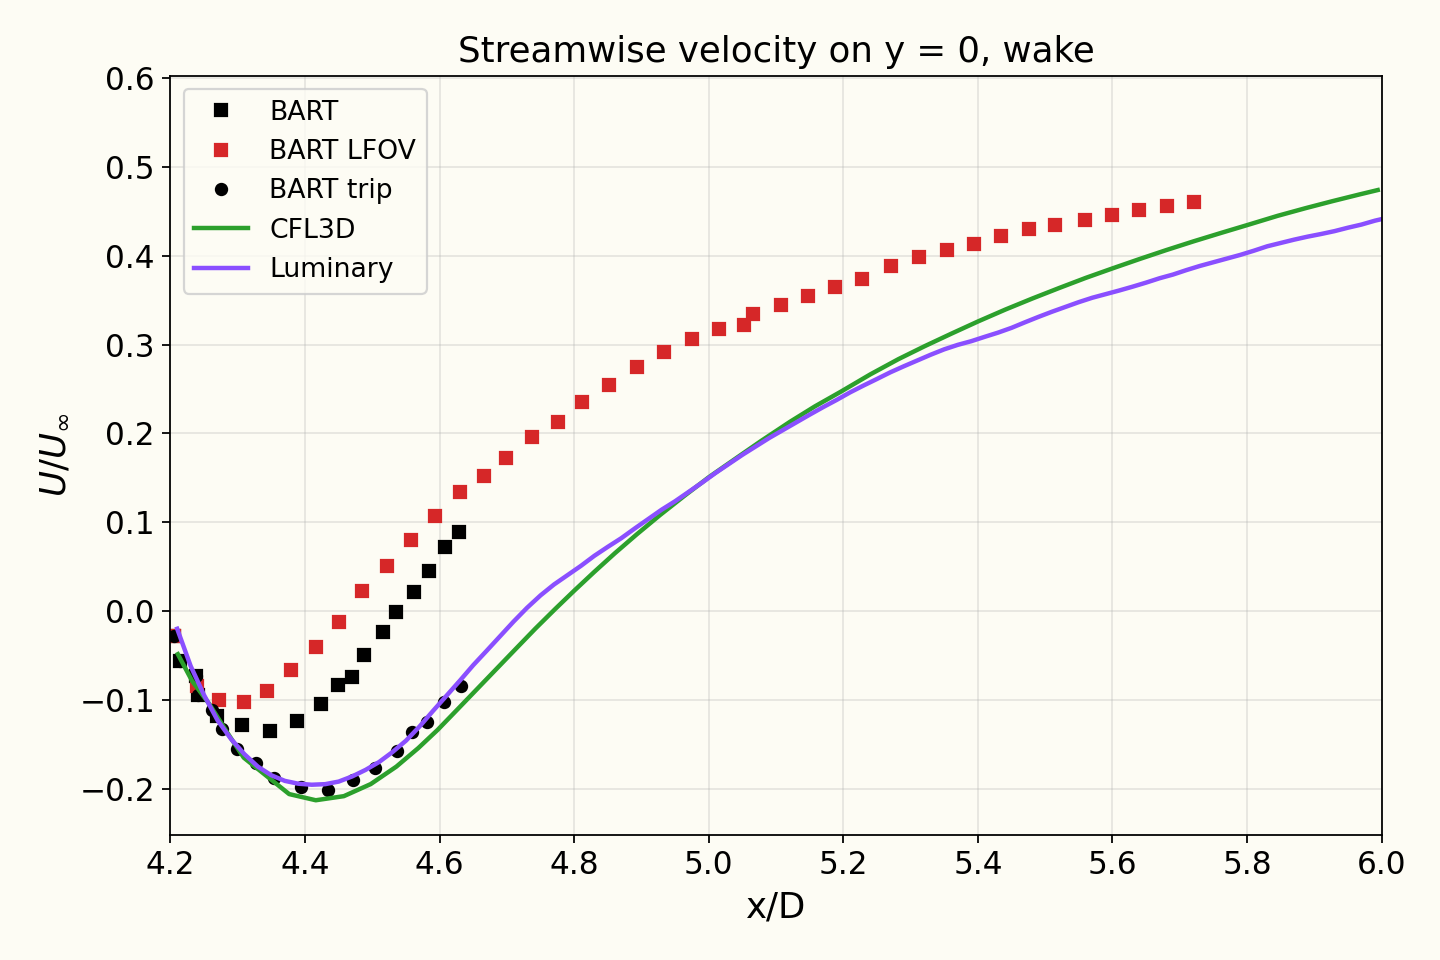
Mean streamwise velocity on the centreline
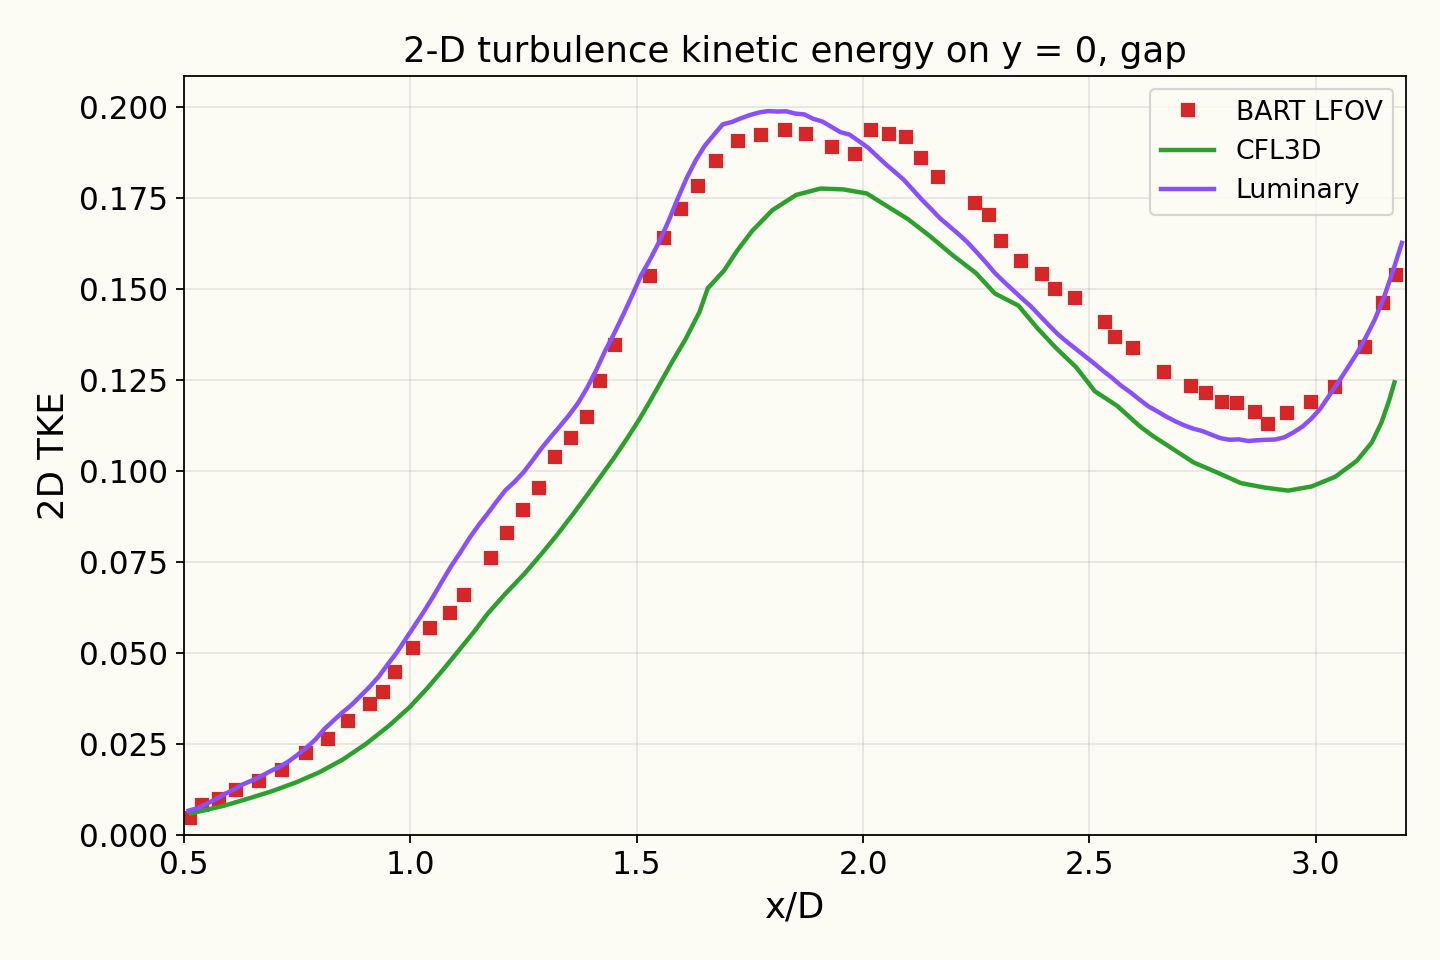
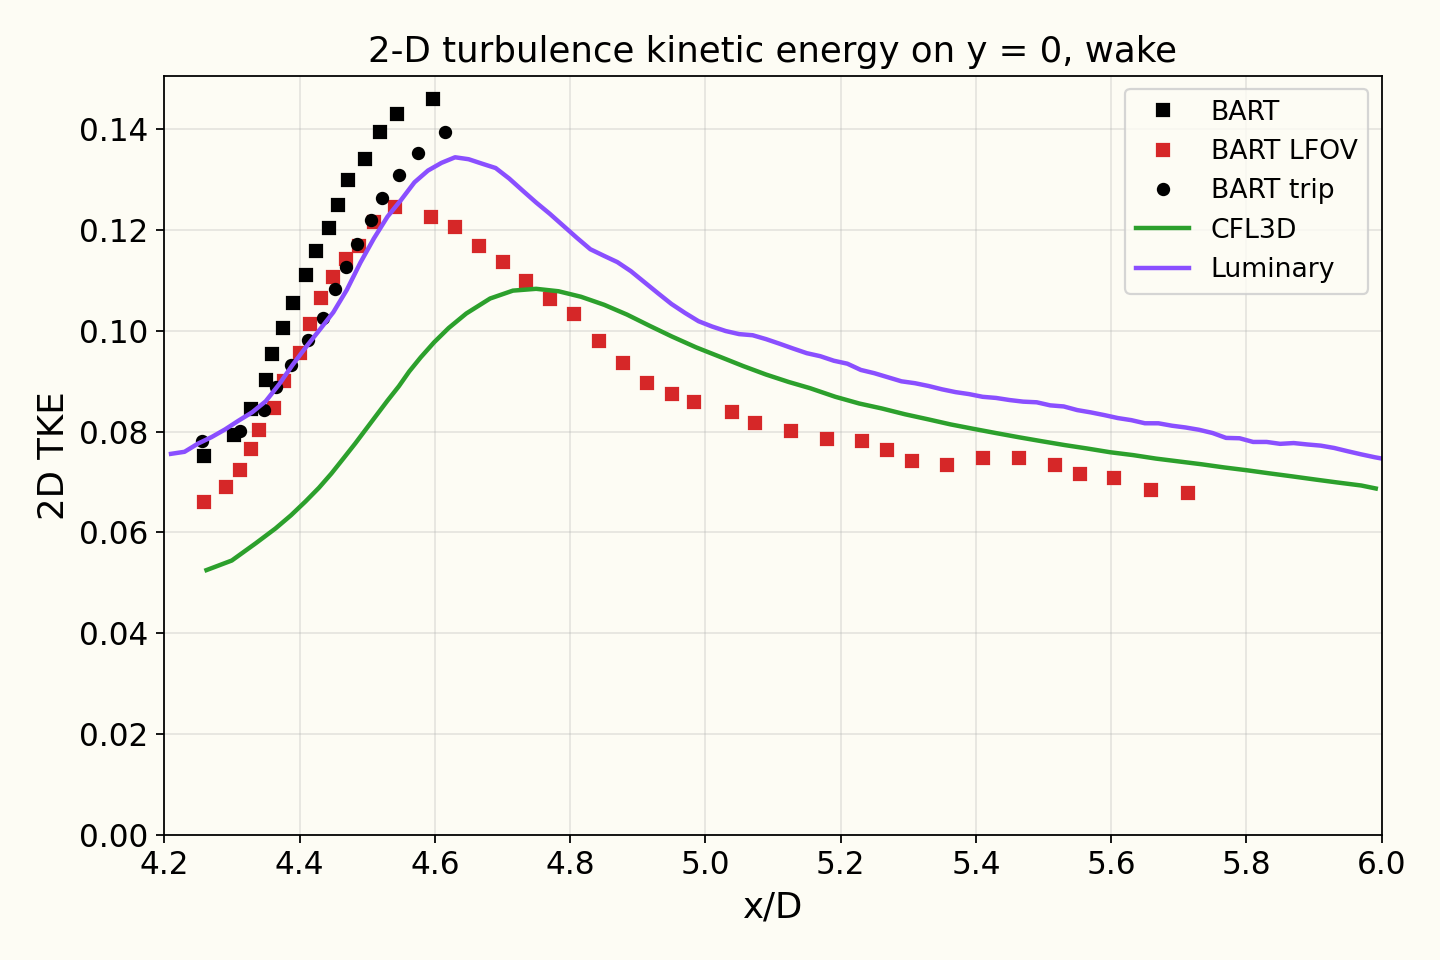
Two-dimensional turbulence kinetic energy on the centreline
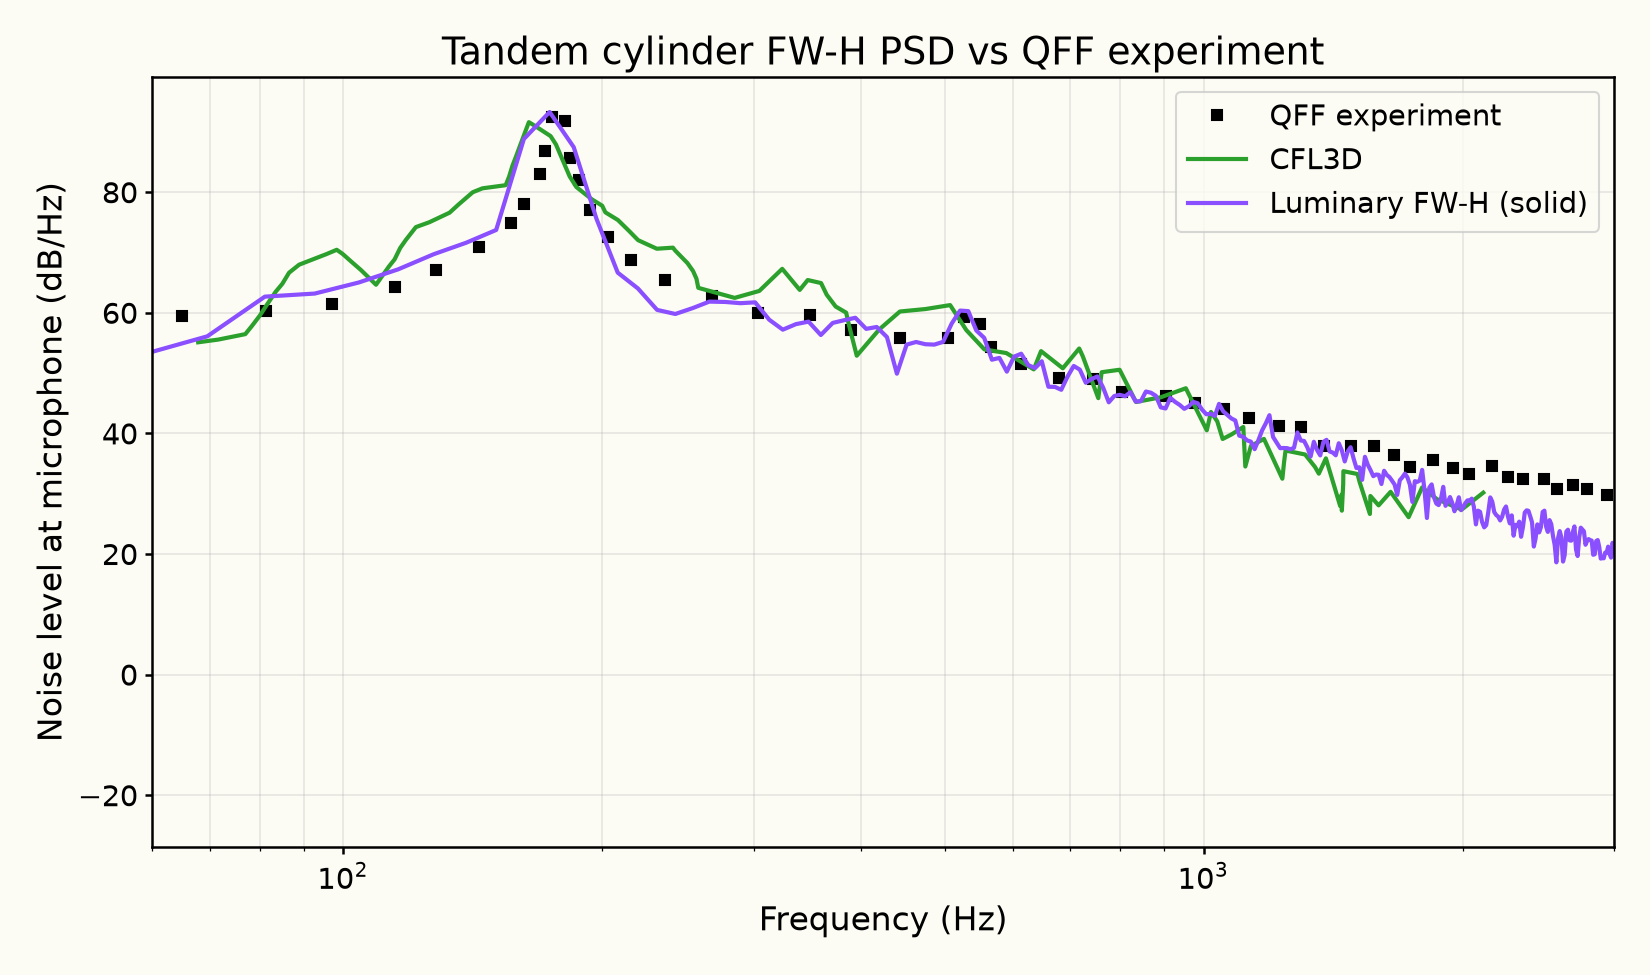
Narrowband spectrum at
Reference: D. P. Lockard, “Summary of the Tandem Cylinder Solutions from the Benchmark problems for Airframe Noise Computations-I Workshop,” AIAA Paper 2011-0353, 49th AIAA Aerospace Sciences Meeting, Orlando, FL, January 2011. (digitized from Fig. 17), https://ntrs.nasa.gov/citations/20110005482
Tonal peak
| Source | Tonal peak frequency (Hz) | Tonal peak level (dB/Hz) |
|---|---|---|
| Luminary | 173.73 | 93.289 |
| QFF (exp.) | 174.68 | 92.522 |
Frequency and span-corrected level of the spectral maximum between 150 and 220 Hz.
Reference: D. P. Lockard, “Summary of the Tandem Cylinder Solutions from the Benchmark problems for Airframe Noise Computations-I Workshop,” AIAA Paper 2011-0353, 49th AIAA Aerospace Sciences Meeting, Orlando, FL, January 2011. (digitized from Fig. 17), https://ntrs.nasa.gov/citations/20110005482
Discussion
The upstream cylinder sheds vortices that hit the downstream cylinder. The surface pressure on the downstream cylinder fluctuates several times more strongly than on the upstream one (compare the two RMS pressure plots), which makes it the louder of the two. The sound is a strong tone at the shedding frequency with a broad hiss on either side.
Most of the page compares the flow, because the sound depends on the flow that makes it. On the upstream cylinder the mean and RMS (root-mean-square, a measure of how strongly the pressure fluctuates) surface pressure follow the Quiet Flow Facility (QFF) measurements. On the downstream cylinder the pressure fluctuations peak at the same angles as measured, and the surface pressure spectrum follows the measurement within a few decibels from Hz to kHz. In the gap between the cylinders the turbulence kinetic energy follows the measurement, and behind the downstream cylinder the flow follows the Basic Aerodynamic Research Tunnel (BART) measurements made with both cylinders tripped.
The narrowband spectrum compares the predicted sound at the microphone with the QFF measurement. The simulation covers 3 diameters of span and the experiment 16, and a longer cylinder radiates more sound, so the simulated spectrum is scaled up to the experiment's span before the comparison, as described in the problem setup. The tone is at Hz against the measured Hz, a difference smaller than the Hz frequency resolution of the spectrum, and its level is within dB of the measurement. From about Hz to kHz the computed spectrum is within about dB of the measured broadband level, including the smaller peak near Hz, and it continues to follow the measured decline up to kHz, up to dB lower.
Solver configuration
- features exercised
- Validation3DDES/LESSpalart–AllmarasIdeal gasUnsteadyEnergy equationFW-H (solid / permeable surface)