
Cylinder at Re = 3900: FW-H Against Literature
verification
Animation of the divergence of the velocity (the dilatation) on a plane through the cylinder, which shows the sound radiated by the turbulent wake, with isosurfaces of the vortical structures coloured by the velocity magnitude.
Overview
A circular cylinder at a Reynolds number of 3900 sheds a turbulent wake whose pressure fluctuations radiate a tone at the shedding frequency and its harmonics. This case simulates the flow with a large-eddy simulation and predicts the far-field sound with the Ffowcs Williams-Hawkings (FW-H) analogy, evaluated on the cylinder wall. The flow statistics are compared with the simulation of Huo and Du (2024) and with the measurements they compare against, and the sound with their prediction.
Problem Setup
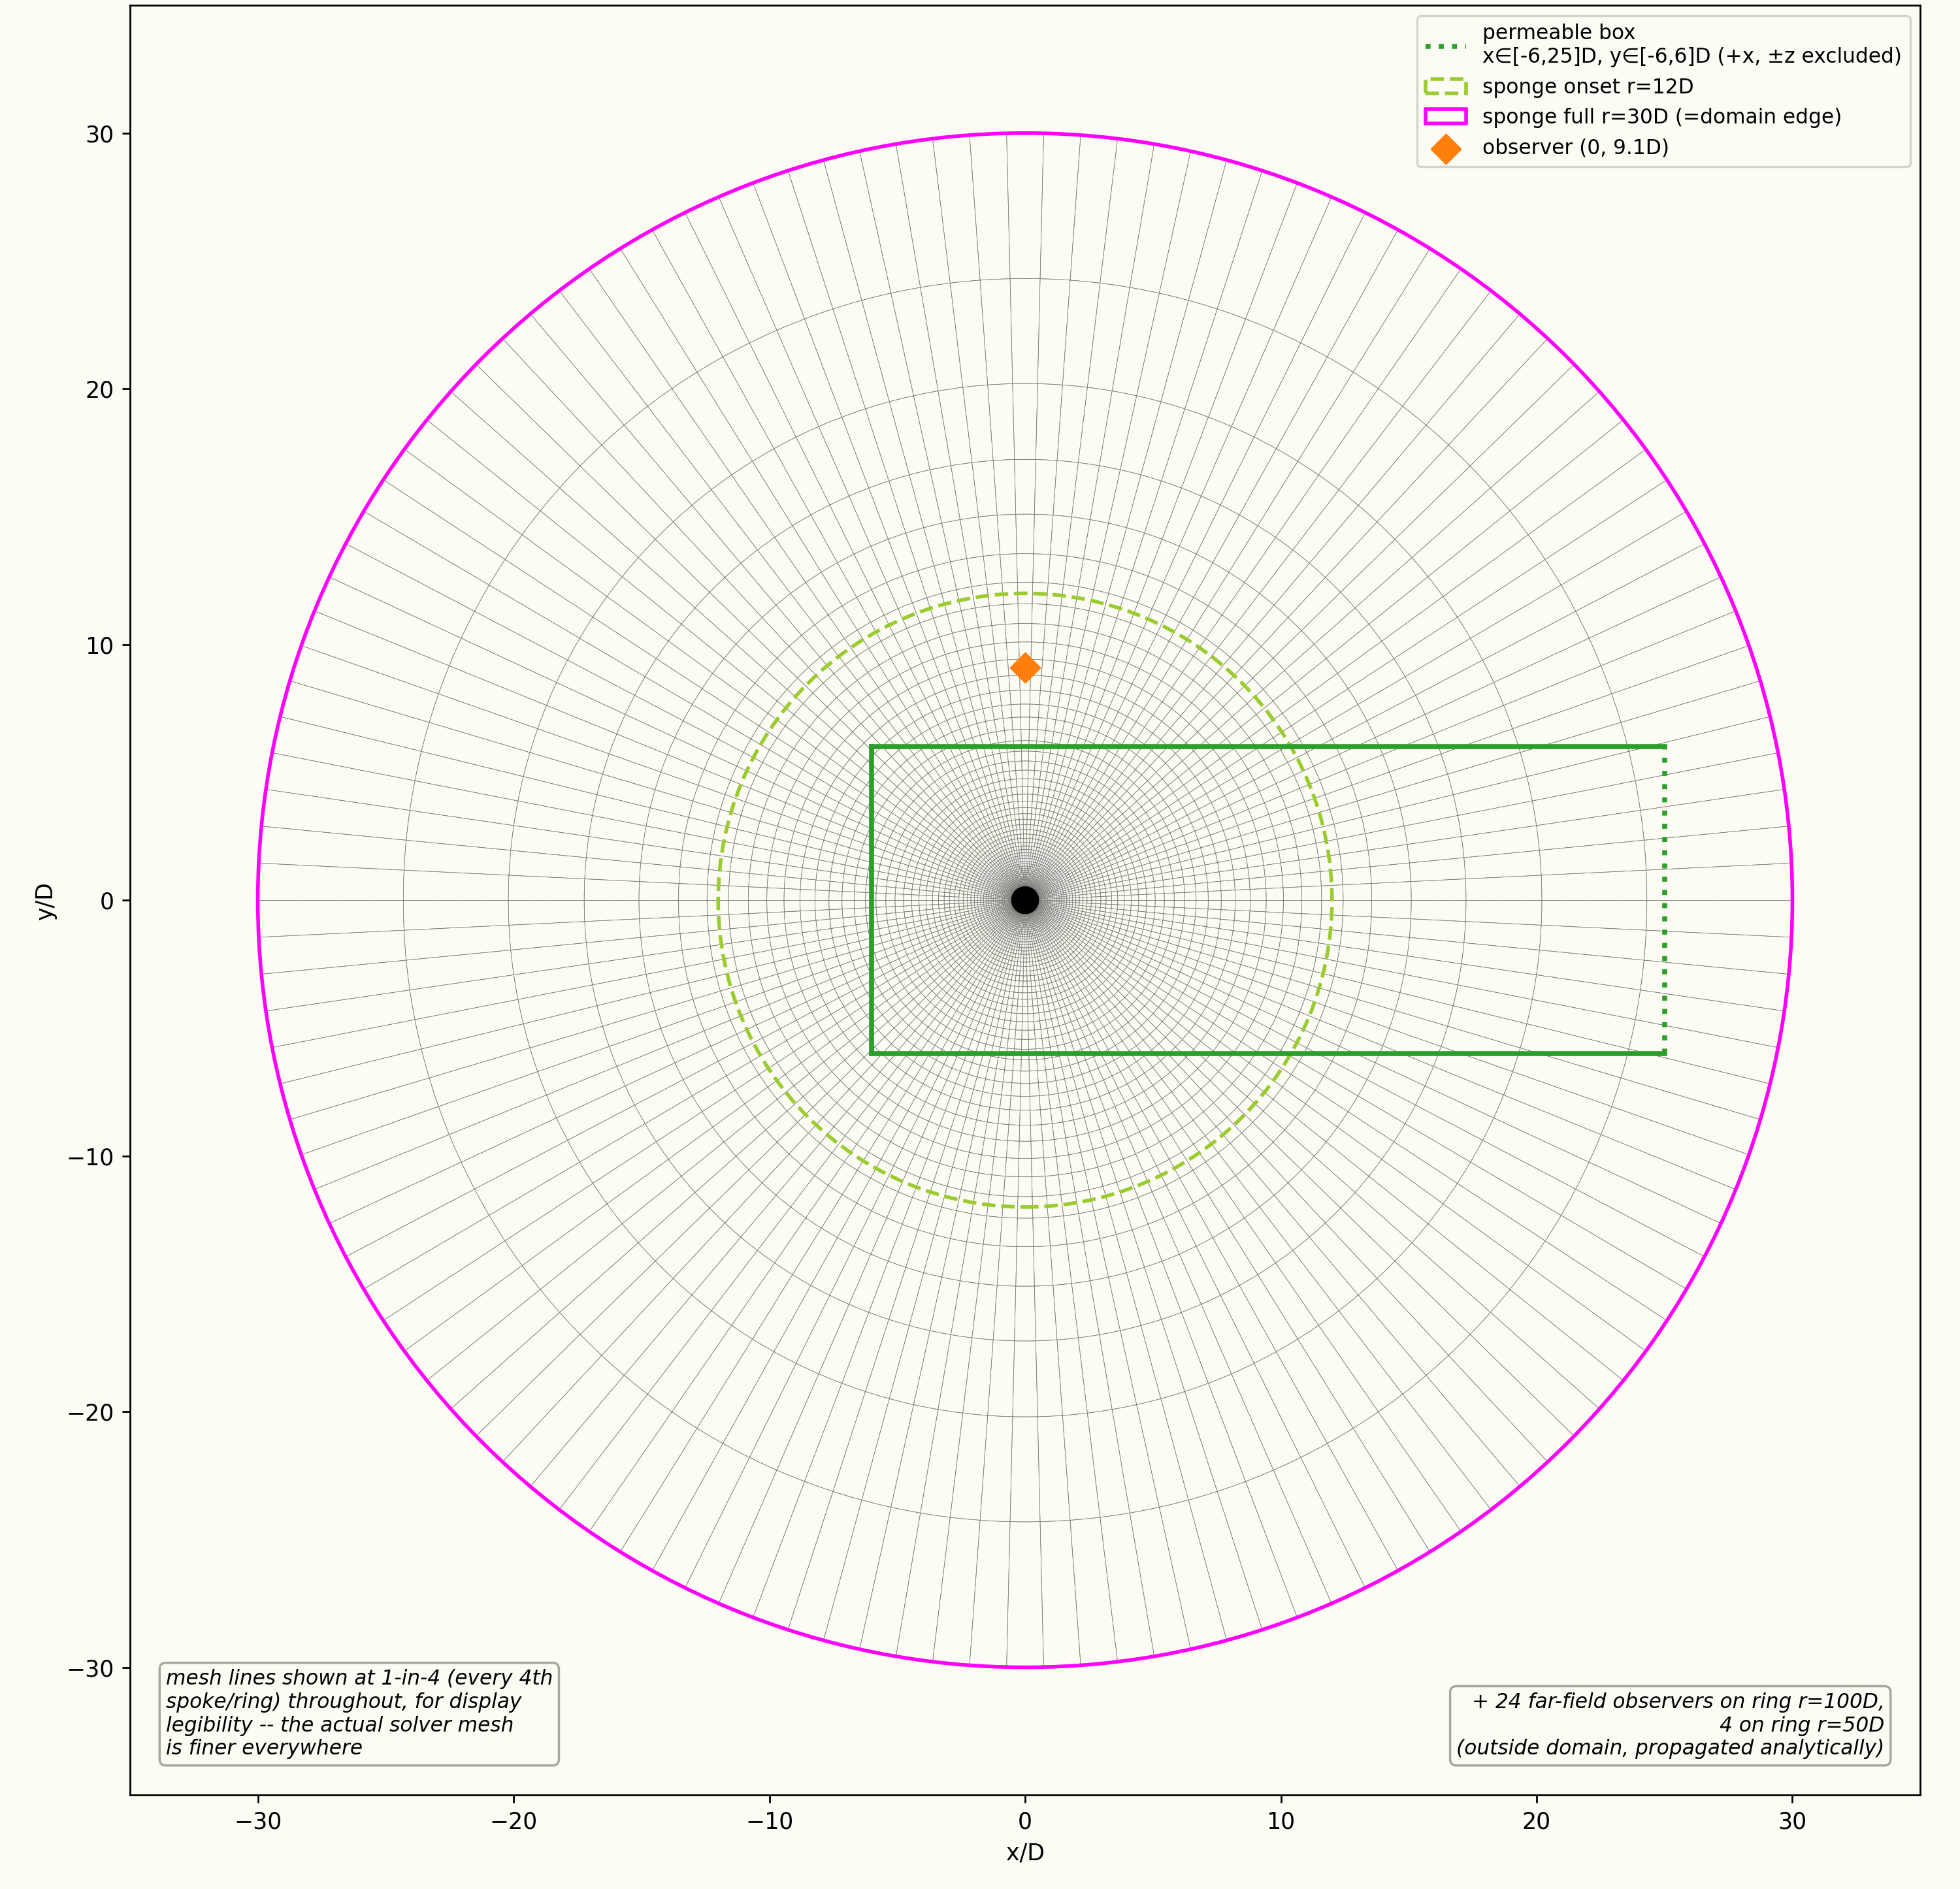
The flow is at ( m/s, K, Pa) with a constant dynamic viscosity chosen so that for a cylinder of diameter . The grid is deep and periodic in the spanwise direction, and a sponge layer that absorbs the outgoing sound starts at and is thick. The large-eddy simulation uses the WALE subgrid-scale model and the FDS convective flux with its hybrid low-dissipation formulation, with second-order implicit time integration and s.
Starting from a fully developed flow, the statistics and the acoustic record are collected over 40,000 time steps. The acoustic pressure is recorded at mid-span, at an observer above the cylinder axis and on a ring of radius . The Ffowcs Williams-Hawkings analogy is evaluated for the simulated span alone.
Quantities of Interest
The mean pressure coefficient on the cylinder, the mean velocity and Reynolds-stress profiles and the velocity spectra in the wake, and the lift and drag force spectra, each compared with Huo and Du (2024), and all but the force spectra also with the measurements of Norberg (2002) and Parnaudeau et al. (2008); and the pressure spectrum at the observer above the cylinder and at the observers away at , and , from the integration surface on the cylinder wall, compared with the FW-H prediction of that paper.
Sources
Results
Mesh and domain
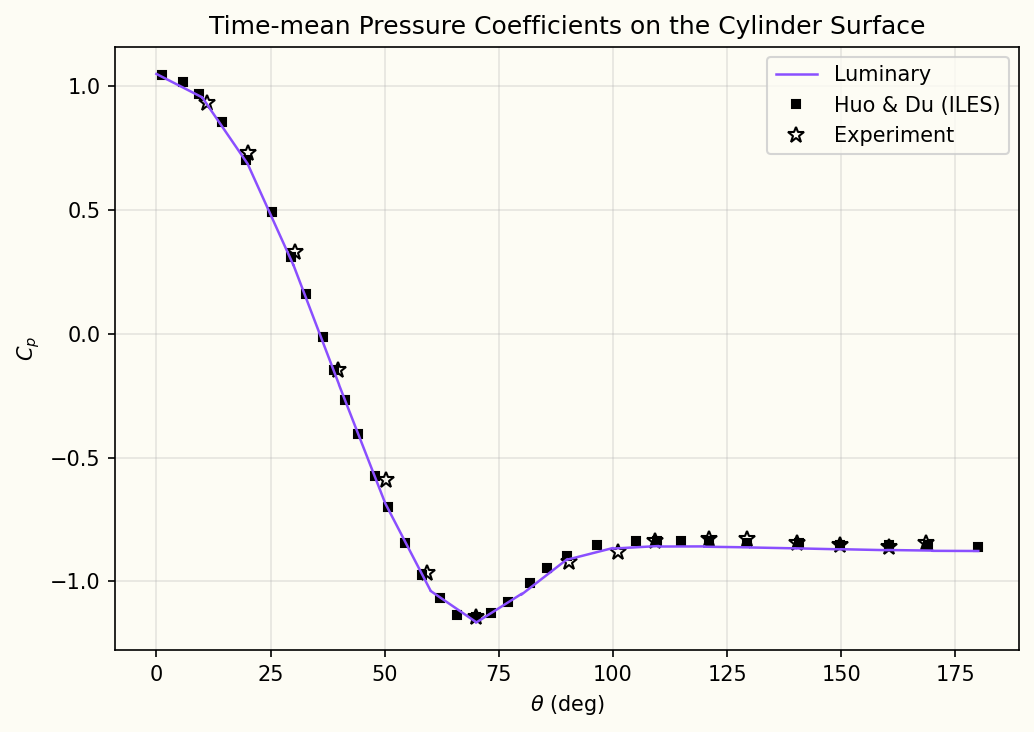
Mean pressure coefficient on the cylinder
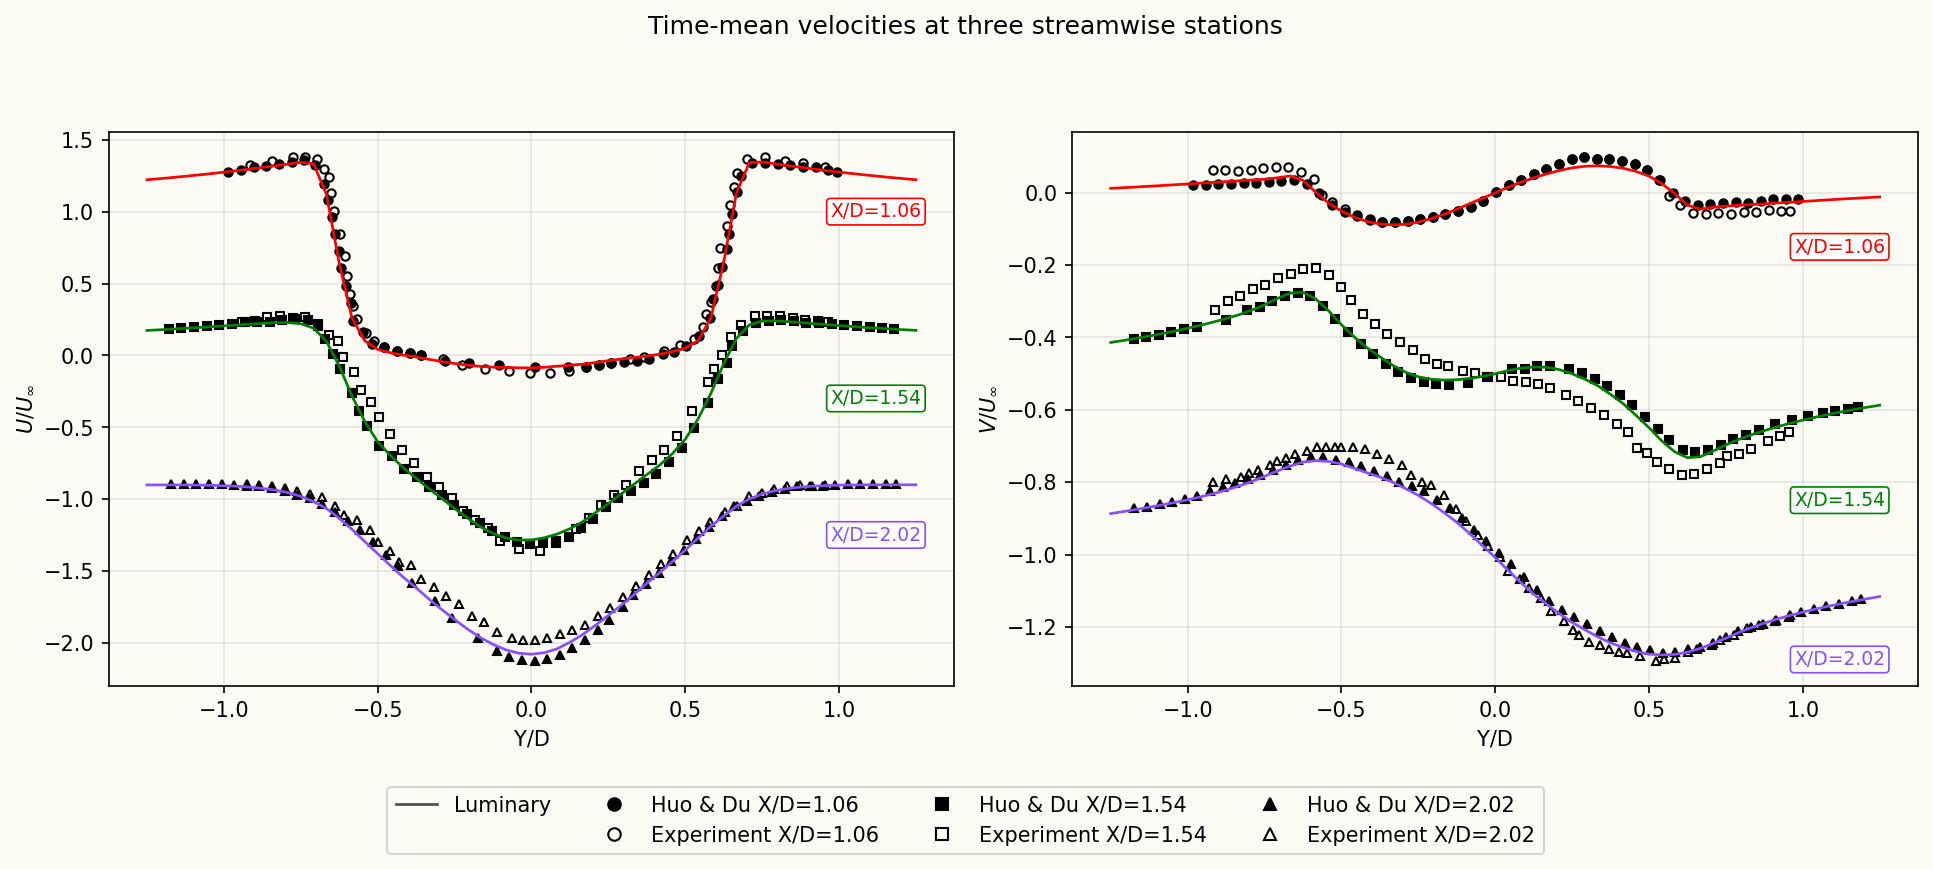
Mean velocity profiles in the wake
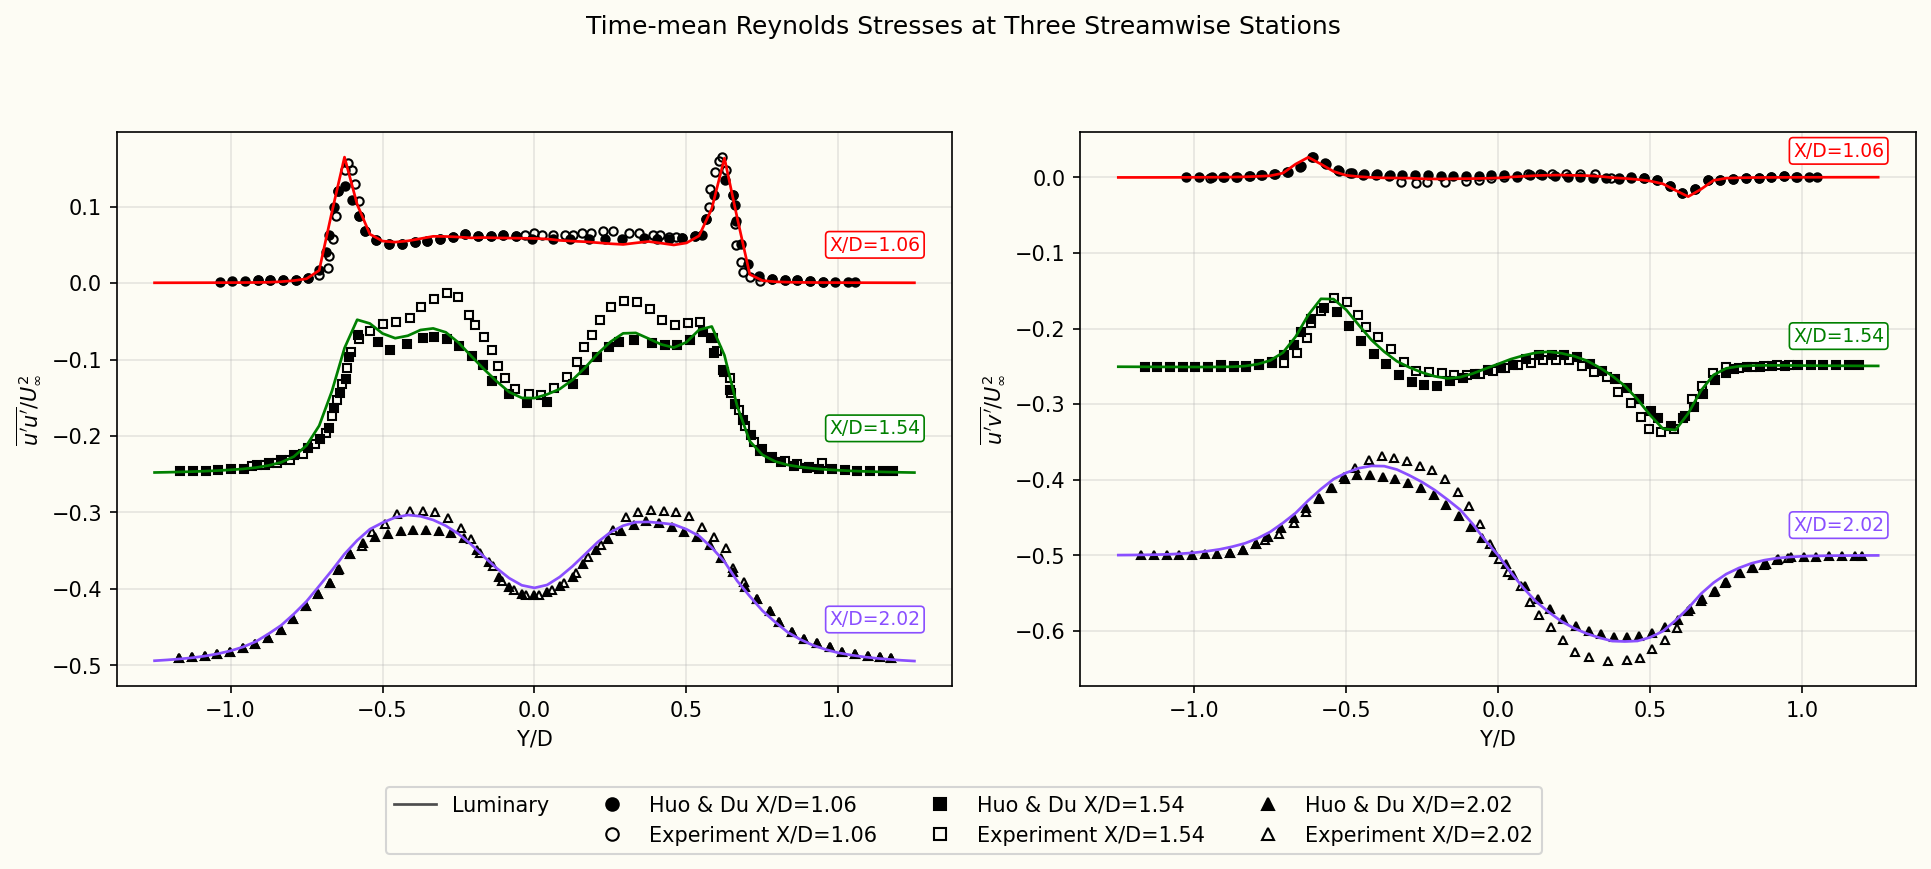
Reynolds stresses in the wake
Velocity spectra in the wake
Lift and drag force spectra
Near-field pressure spectrum at , cylinder wall
Far-field spectra at , cylinder wall
Discussion
Huo and Du (2024) simulated this flow with a large-eddy simulation and compared it with measurements, and the flow plots show both: their simulation as filled markers and the measurements as open markers. The flow statistics come first, because the sound depends on them. The mean pressure on the cylinder follows the simulation and Norberg's measurements, including the suction minimum near , and the mean velocity and Reynolds-stress profiles in the wake follow the simulation and the measurements of Parnaudeau et al. at all three stations.
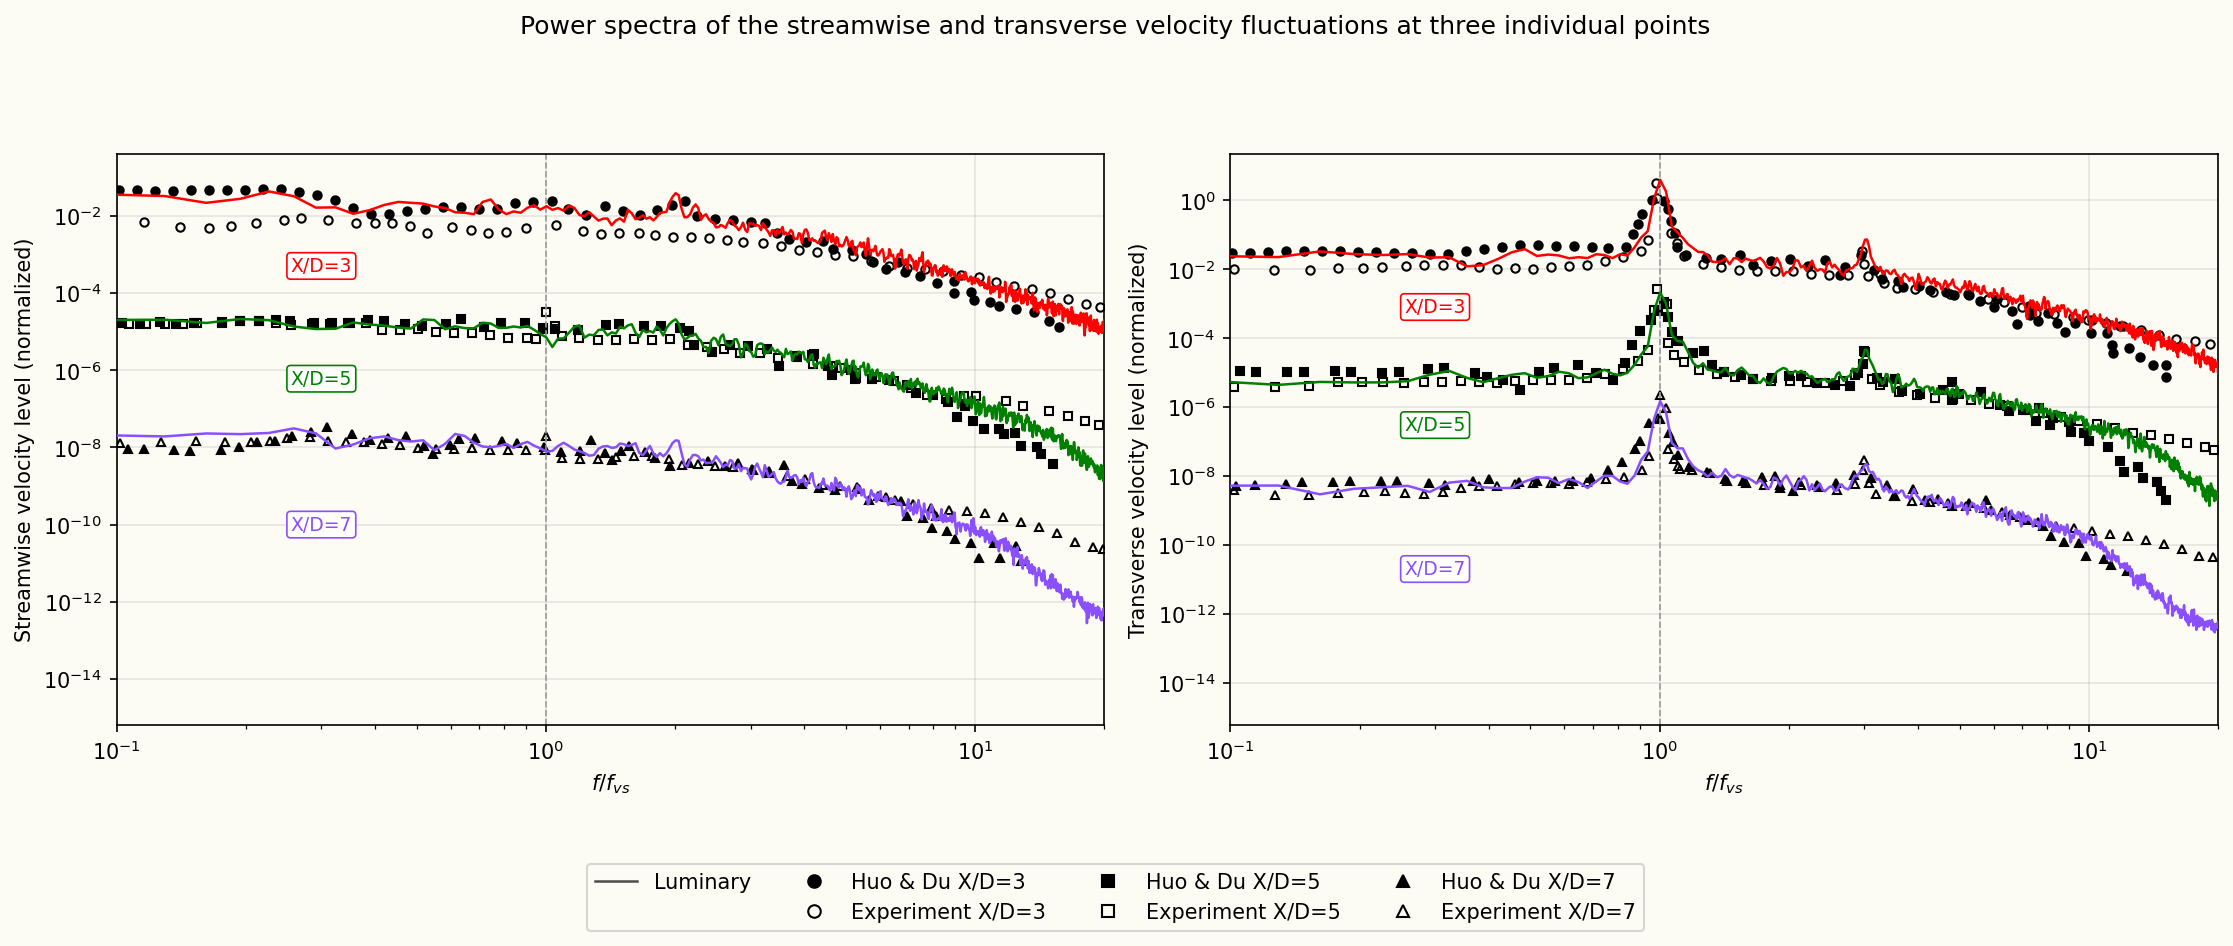
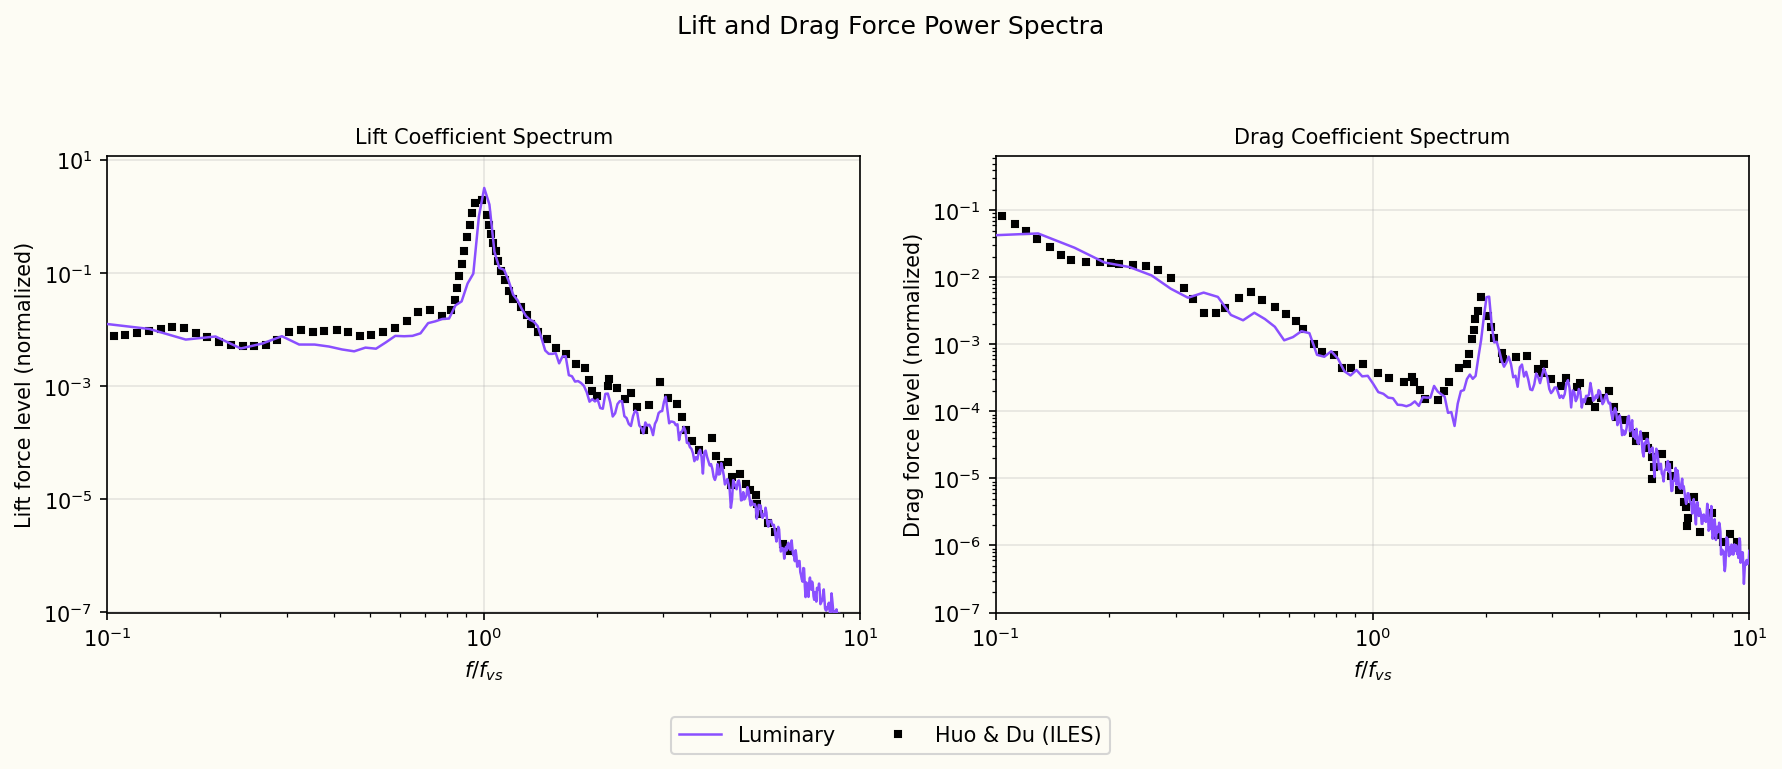
The force spectra show where the sound comes from. The lift peaks at the shedding frequency, because it swings up and down once per shedding cycle. The drag peaks at twice that frequency, because it pulses once for each of the two vortices shed per cycle. The computed force spectra follow the reference across the frequency range, with the peaks at the same frequencies and levels. The velocity spectra in the wake follow both the simulation and the measurements at all three points, in level and in shape, including the peaks of the transverse velocity at the shedding frequency and at three times it.
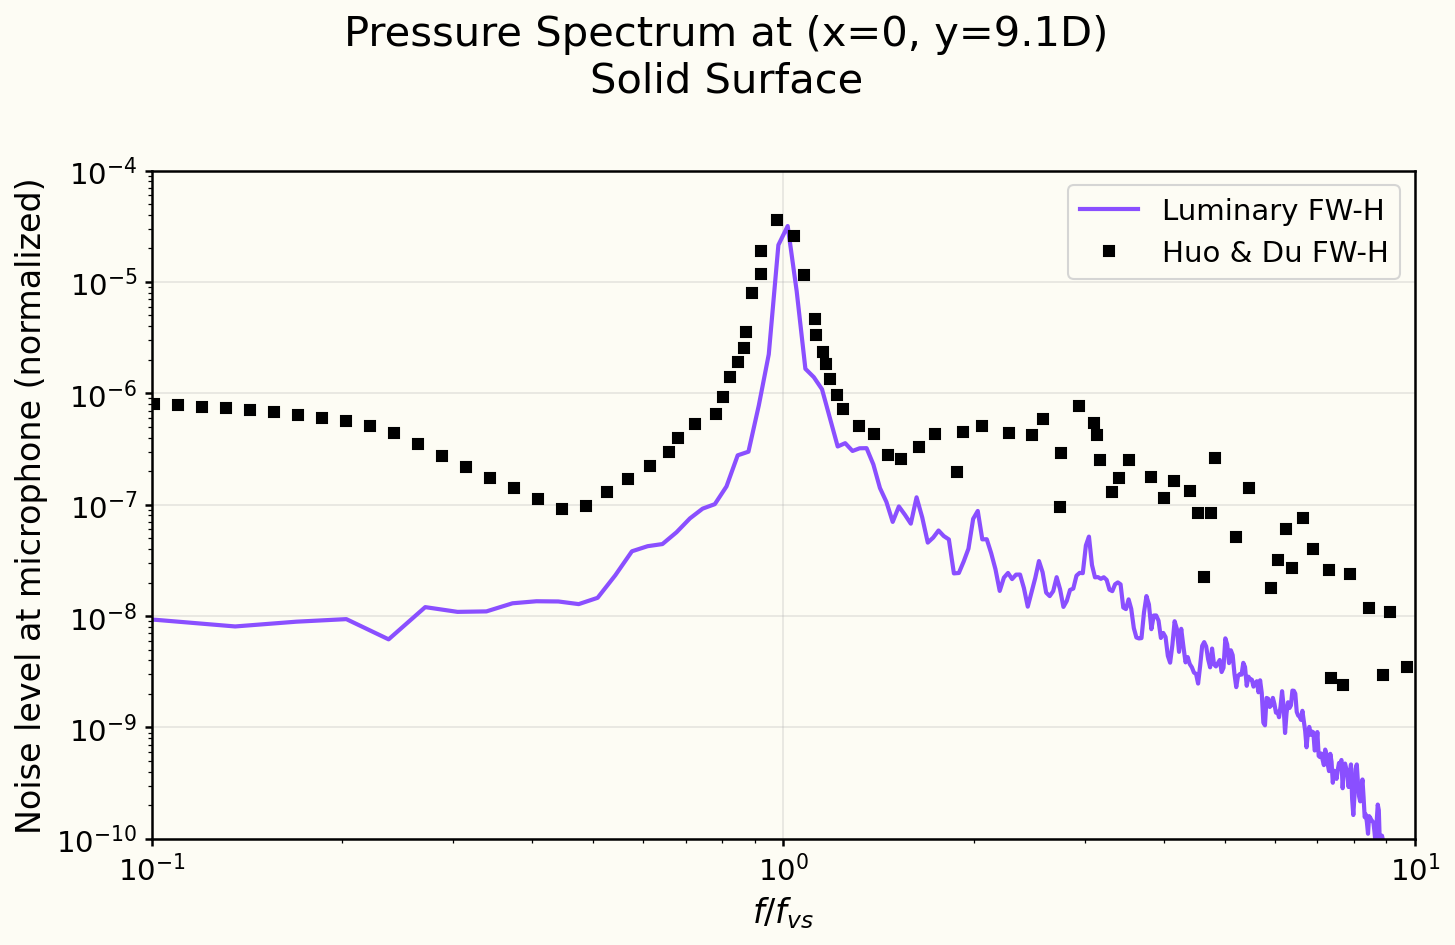
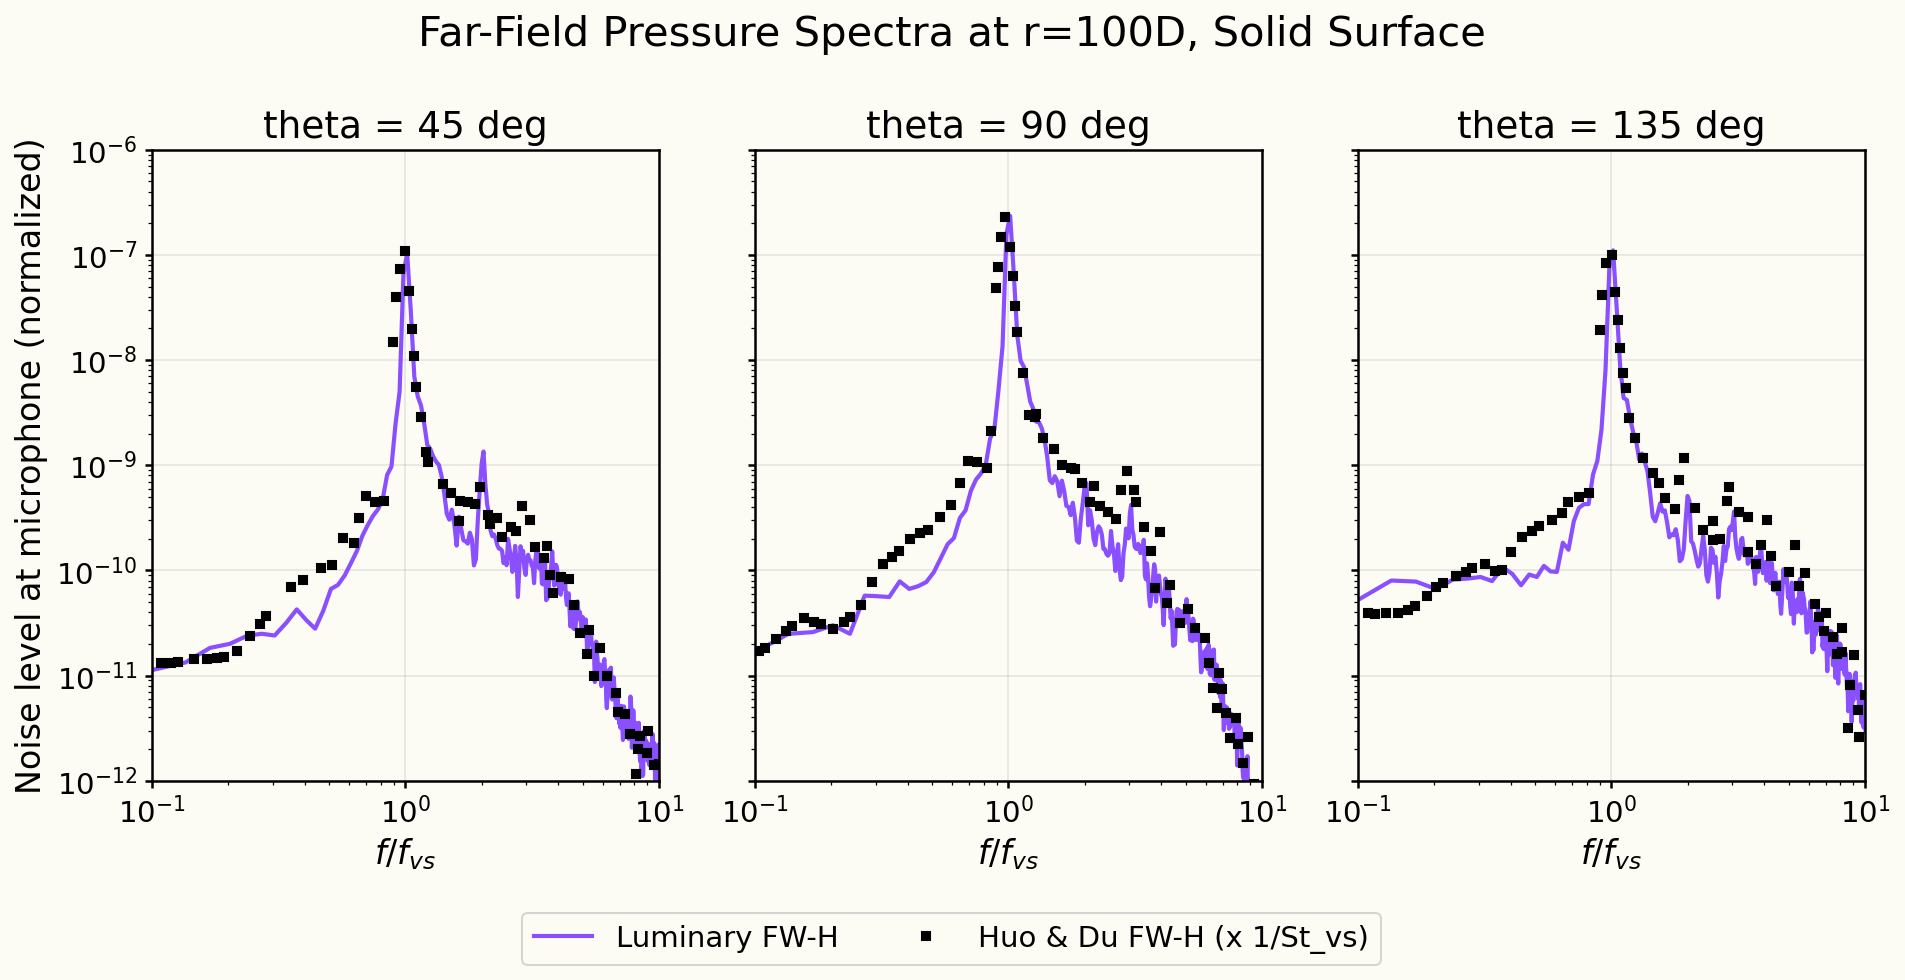
No acoustic measurements have been published for this flow condition, so the sound is compared with the FW-H prediction of Huo and Du. At the near-field observer above the cylinder the tone at the shedding frequency is at the reference level. On the ring away the computed spectra follow the reference at , and : the tone, its harmonics and the broadband sound on either side.
Solver configuration
- features exercised
- Verification3DDES/LESIdeal gasUnsteadyEnergy equationFW-H (solid / permeable surface)