
LAGOON Landing Gear: FW-H Against Literature
validation
Animations of (a) isosurfaces of the Q-criterion around the gear, coloured by the velocity magnitude in m/s, and (b) the divergence of the velocity (the dilatation) on a plane through the gear. The turbulent wake appears as strong small-scale fluctuations in the dilatation.
Overview
The LAGOON landing gear is a simplified two-wheel main gear with a support leg, measured in a wind tunnel for the validation of flow and noise prediction methods. This case simulates the flow with a wall-modelled large-eddy simulation (WMLES) and predicts the far-field sound with the Ffowcs Williams-Hawkings analogy, evaluated on the gear wall and on a permeable surface around the gear in the same flow solution. The far-field spectra, the wall-pressure spectra at the kulite taps, the pressure coefficient around the wheel and the wake velocity statistics are compared with the measurements of Manoha et al. (2008, 2009).
Problem Setup
The flow is at ( m/s, K, Pa). The turbulence is resolved with a large-eddy simulation using the Vreman subgrid-scale model and a wall model on the gear surface, with the FDS convective flux and its hybrid low-dissipation formulation, and second-order implicit time integration with s. A sponge layer that absorbs the outgoing sound starts 3 m from the origin and is 2 m thick.
The flow is first advanced 20,000 time steps from freestream values to let the start-up transient pass, then 21,000 more, over which the acoustic and probe records are collected. The acoustic pressure is recorded 6 m from the origin at , and , both in the flyover plane and on the sideline. The permeable surface is the box , , m. Probes record the pressure at the kulite taps and on a ring around the wheel, and the velocity along the wake lines.
Quantities of Interest
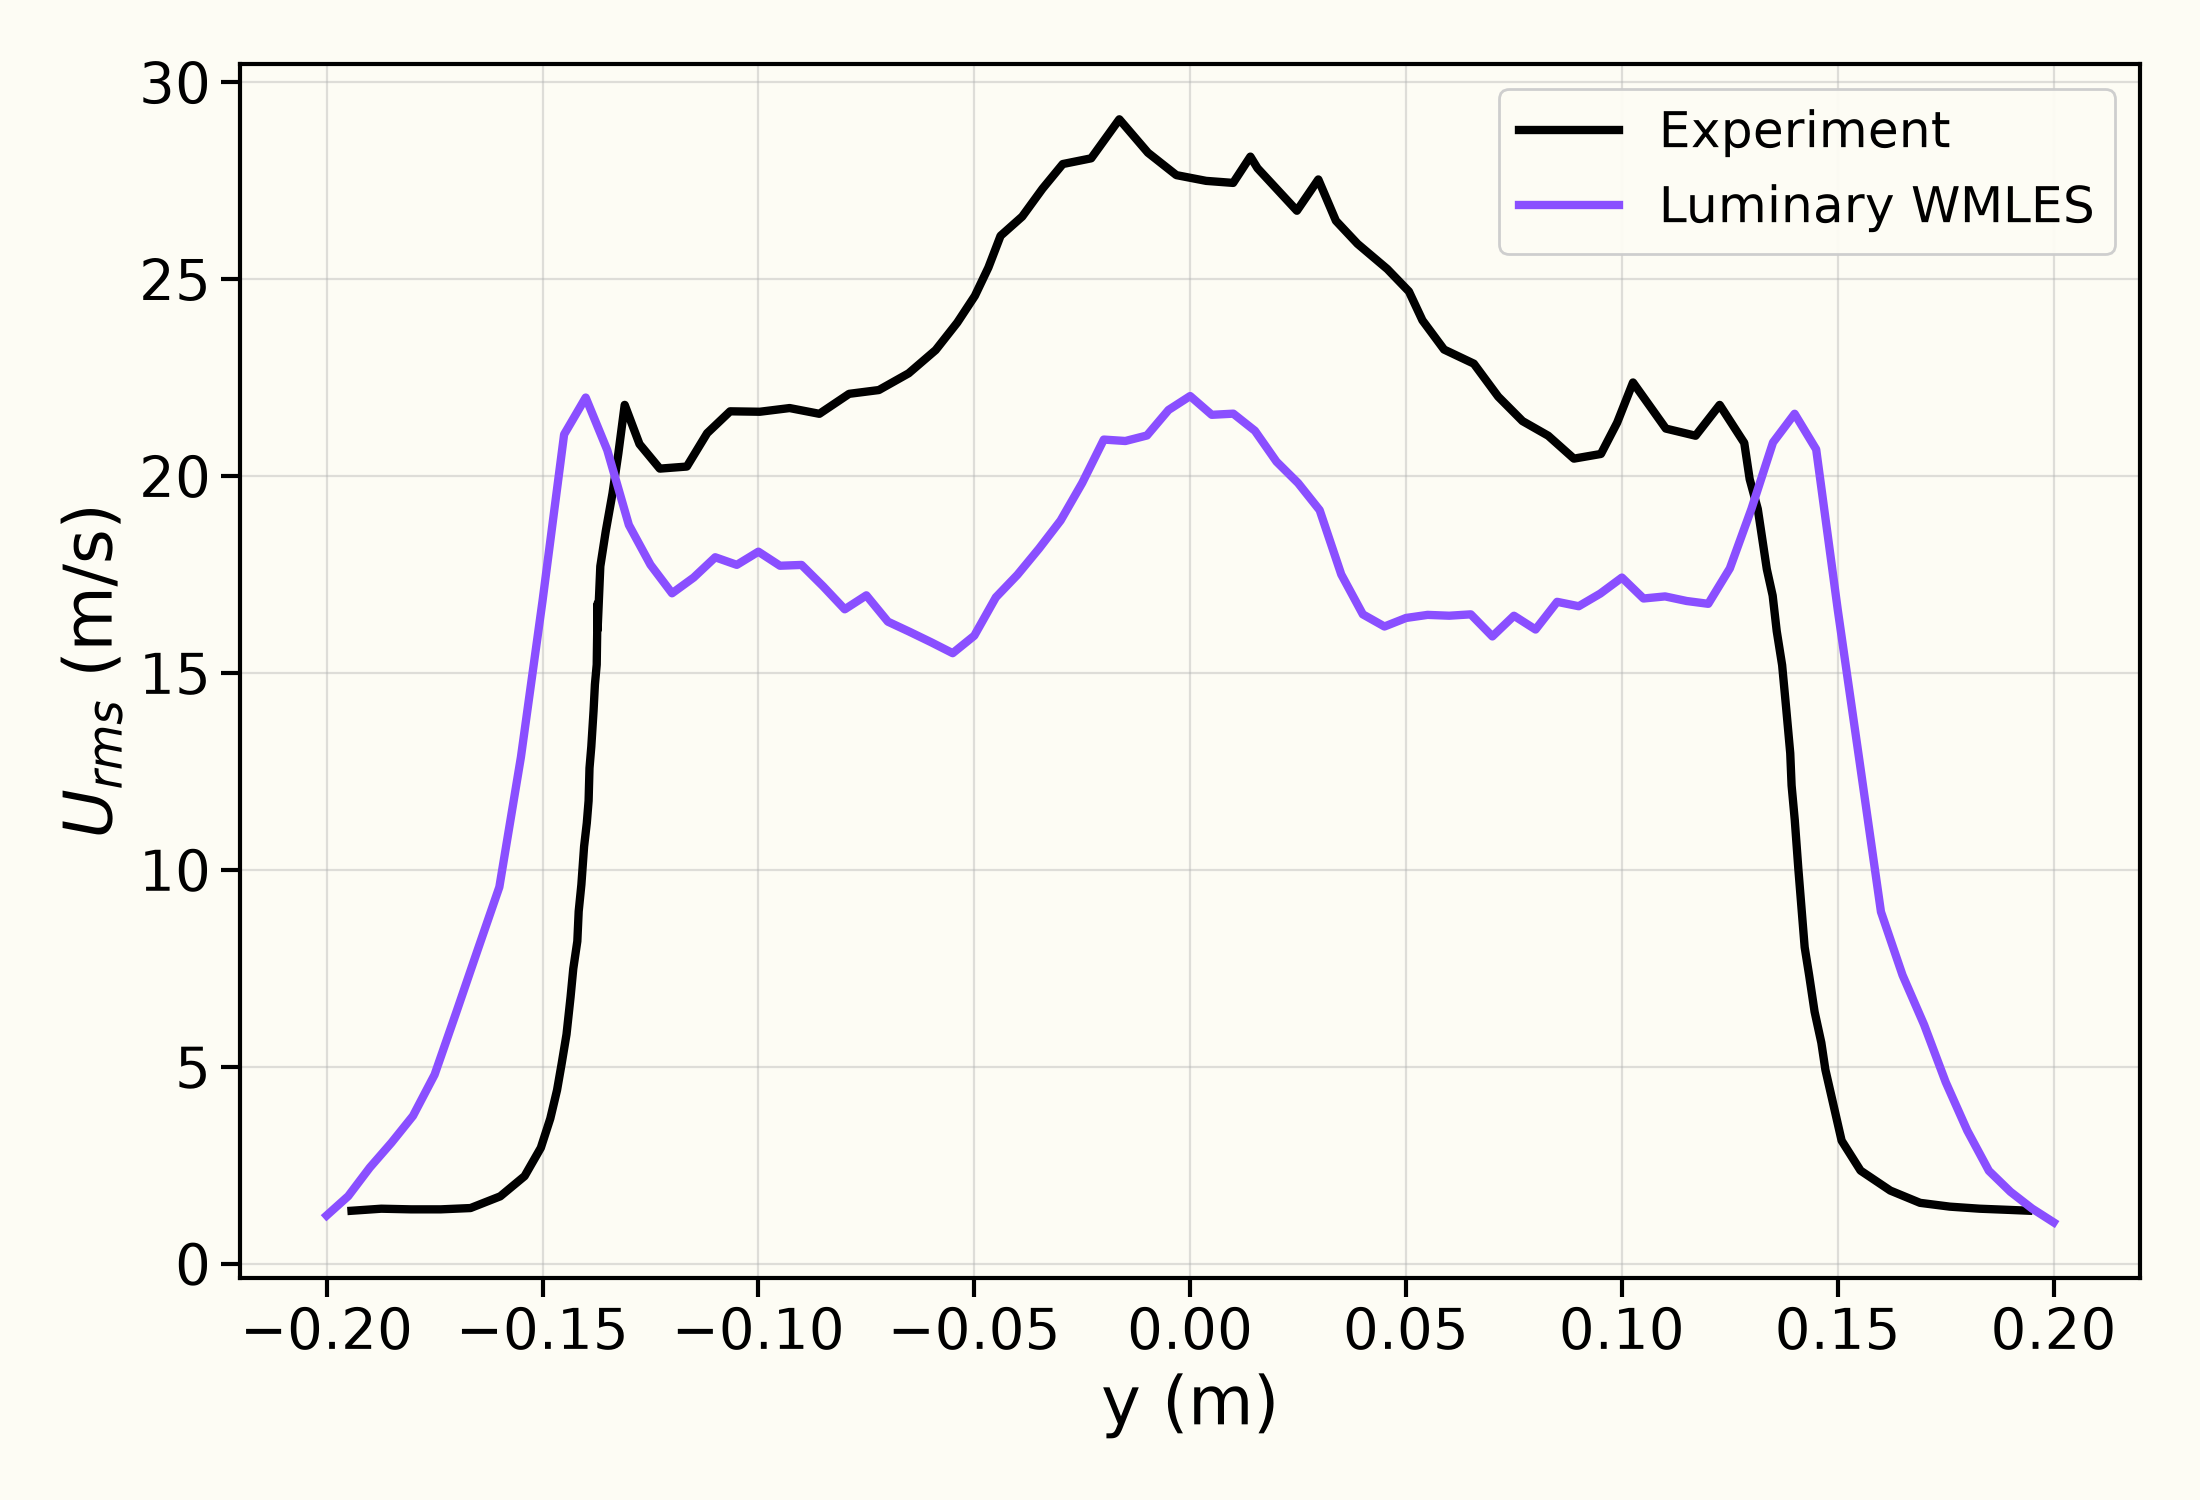
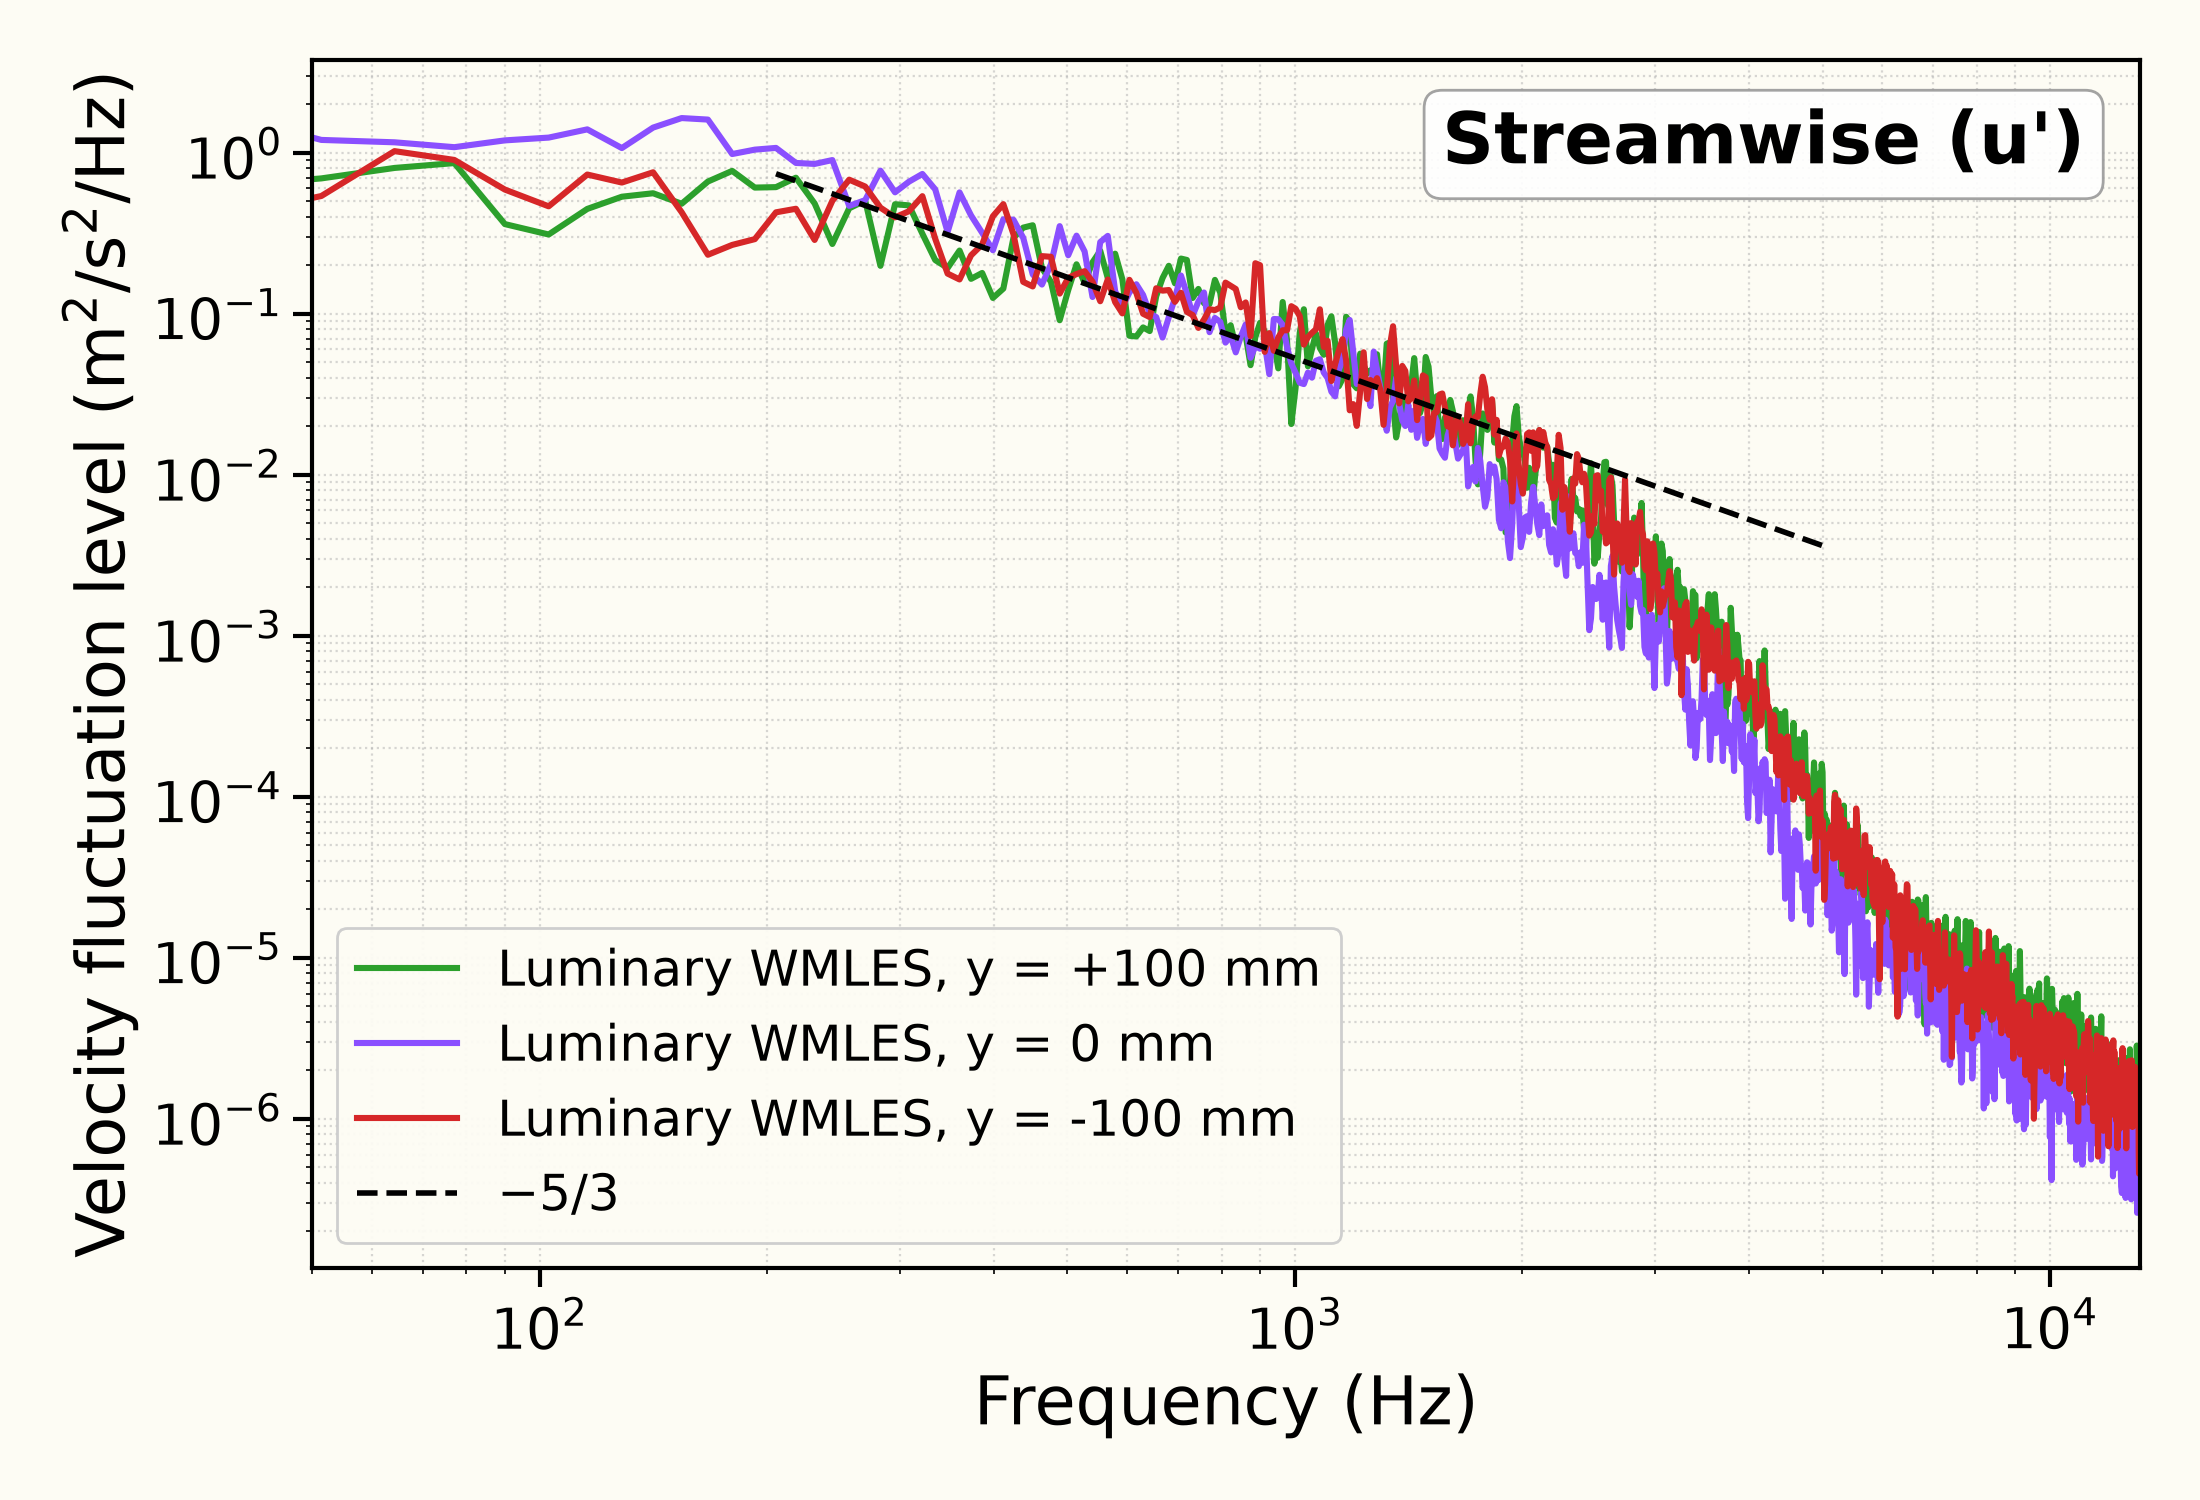
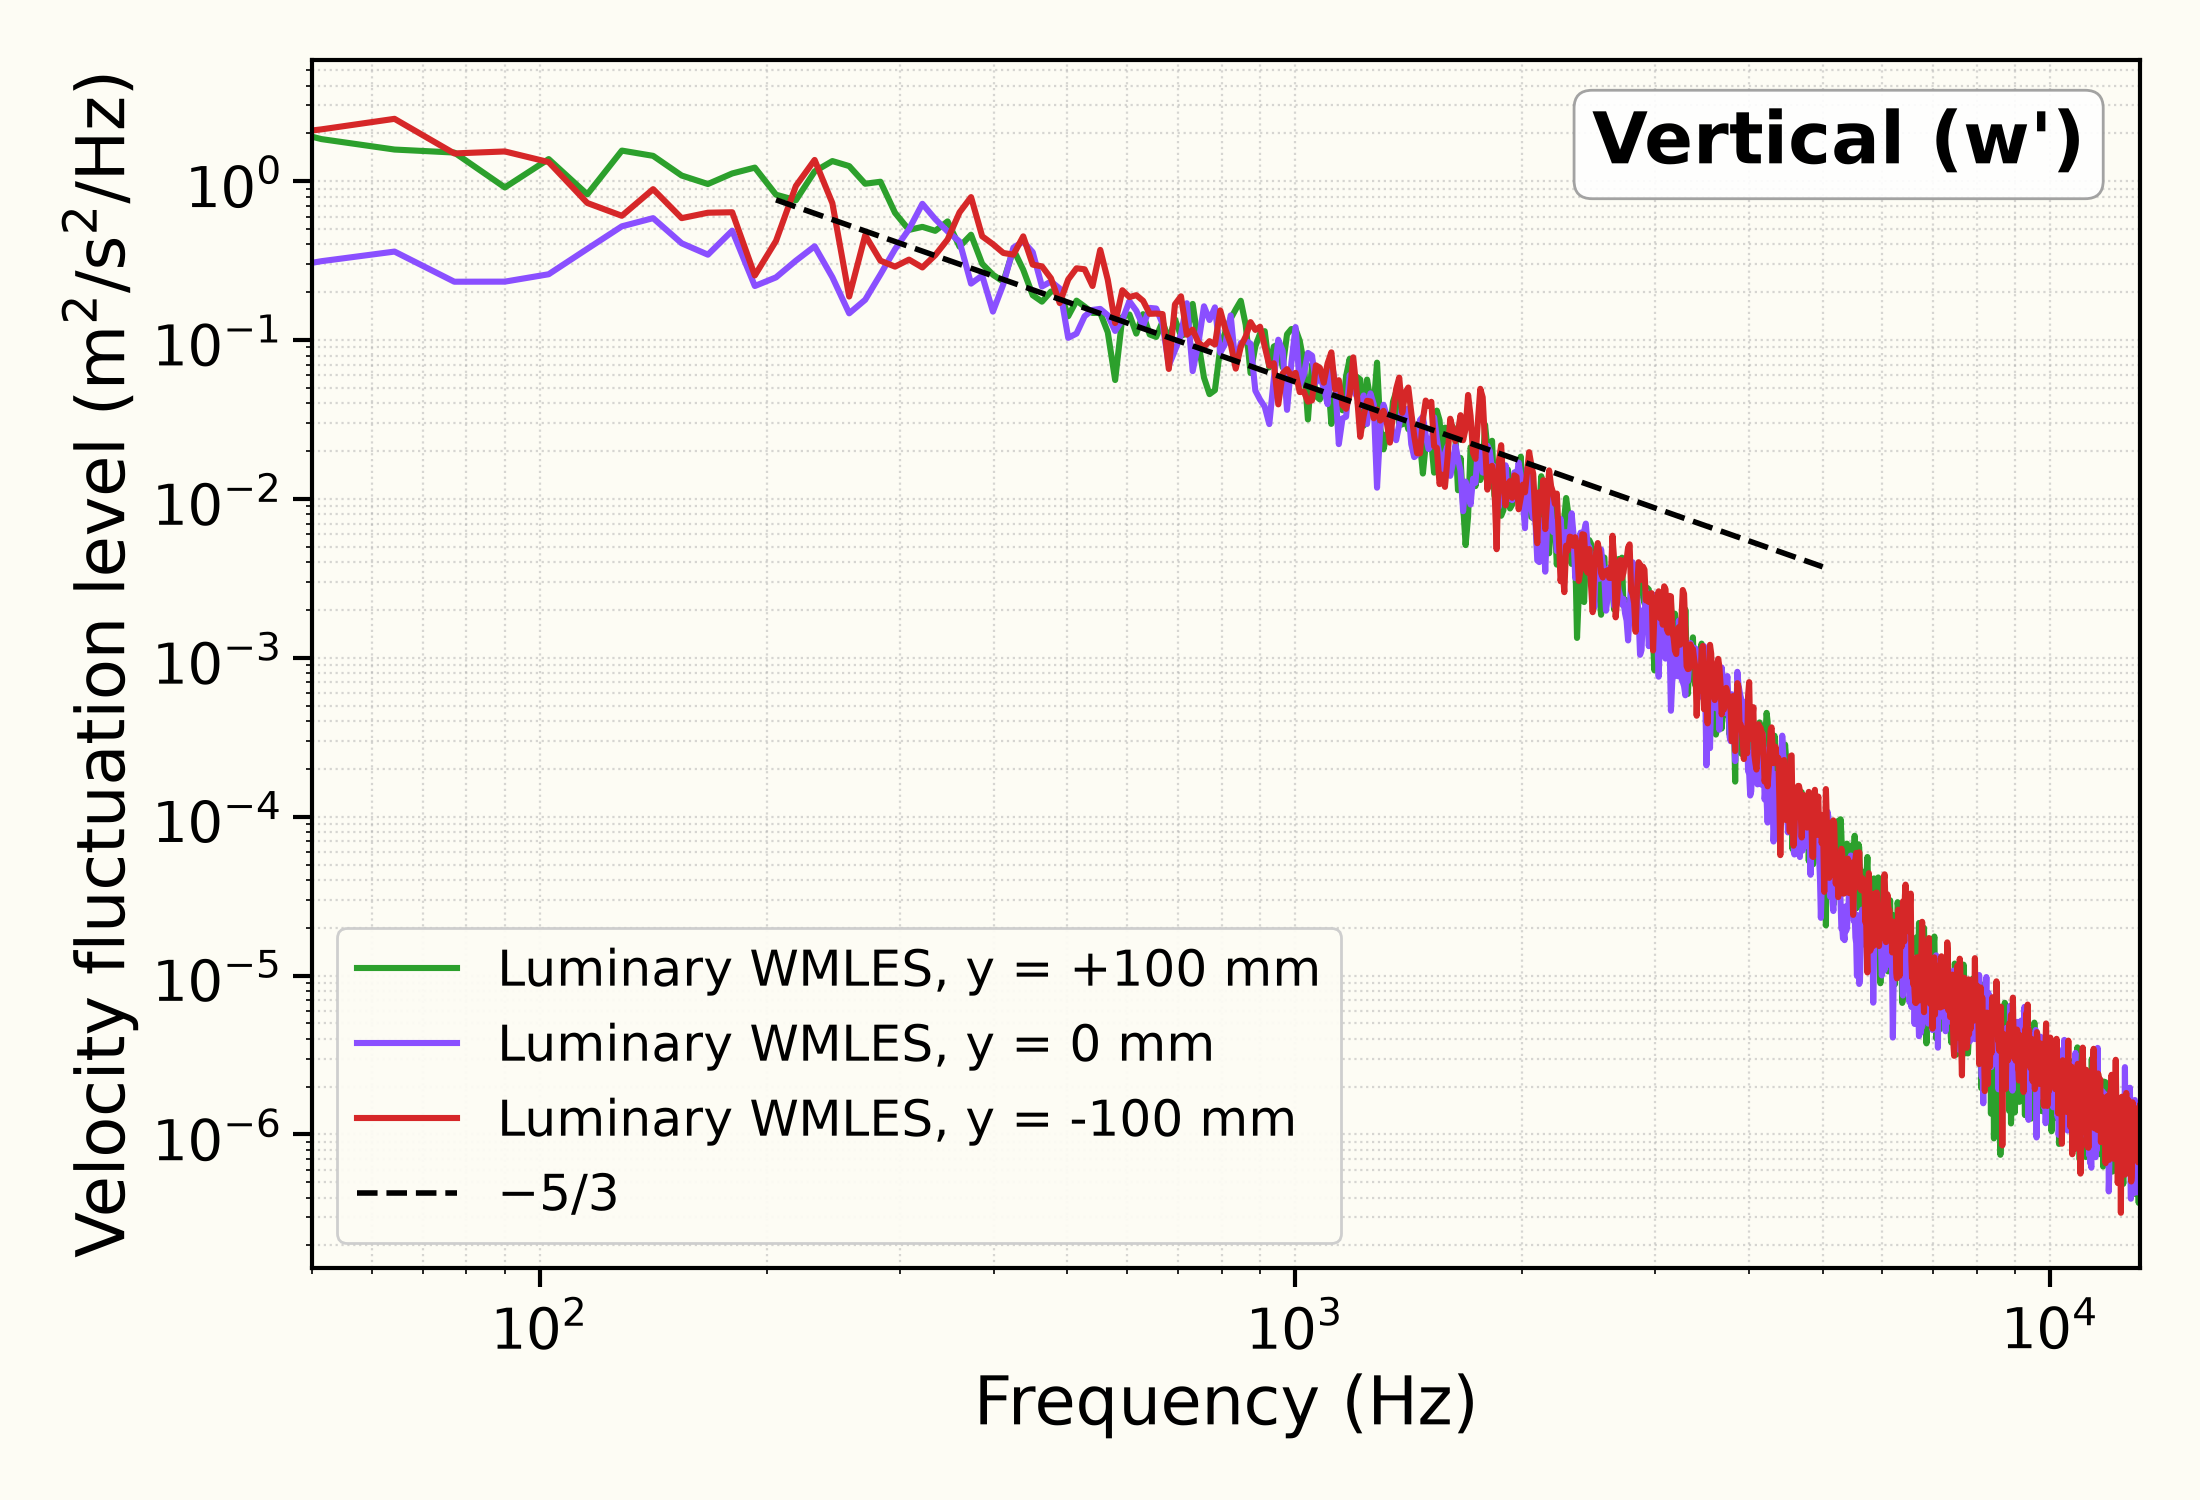
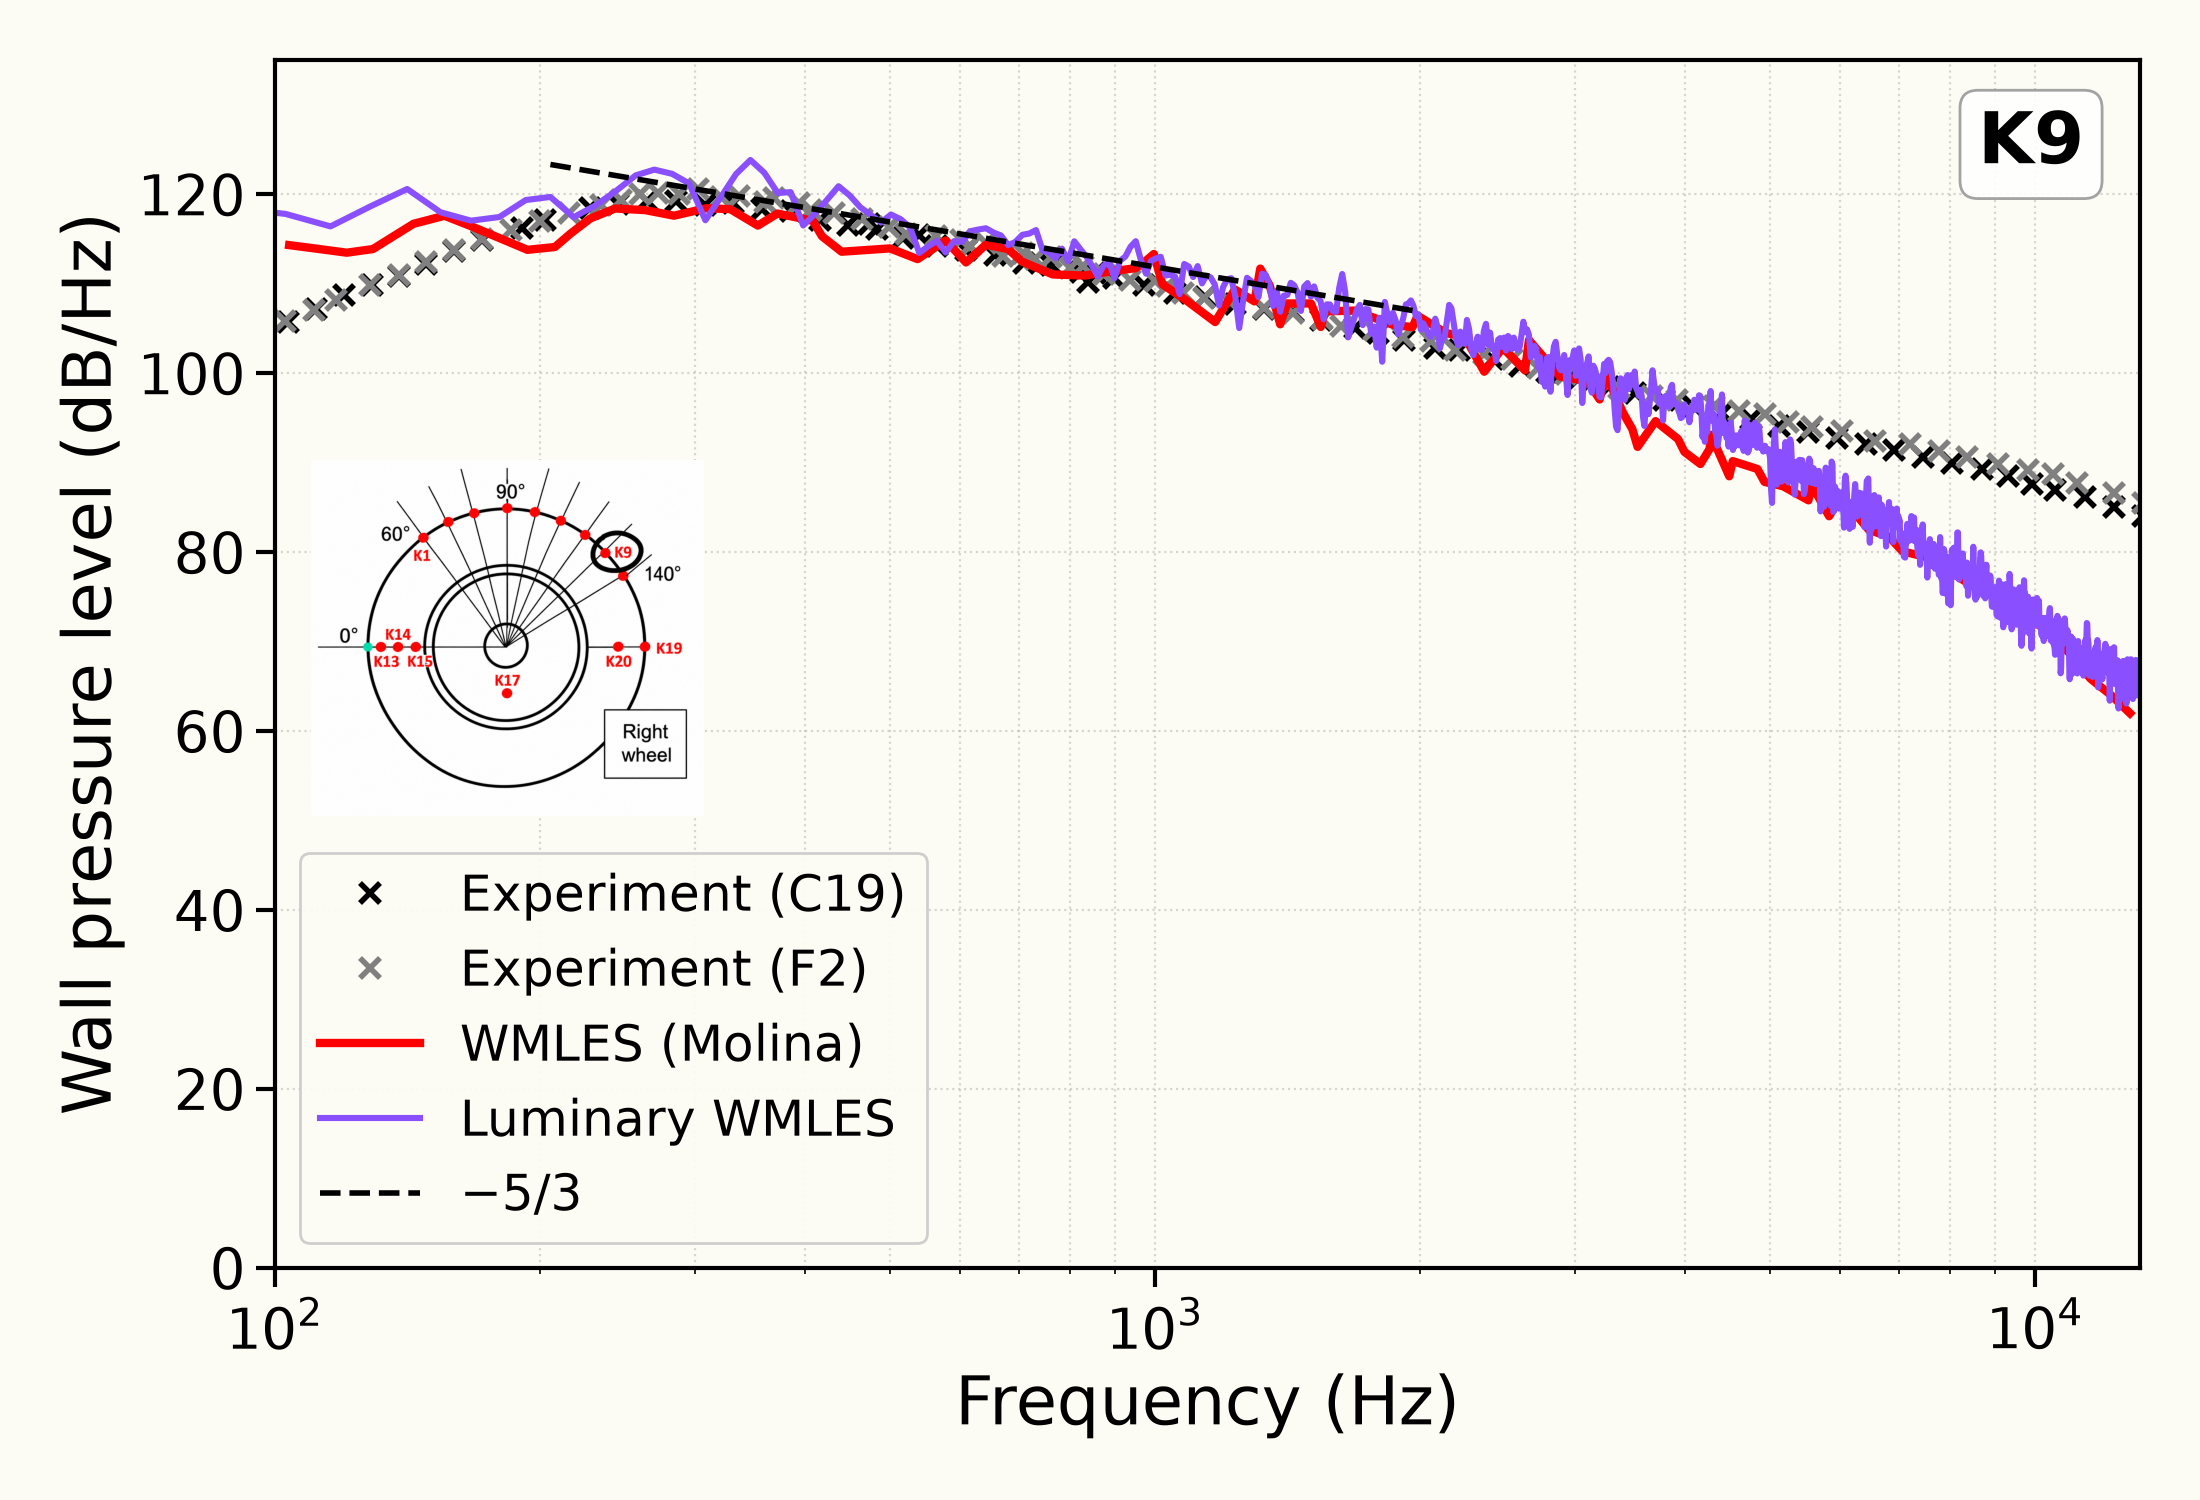
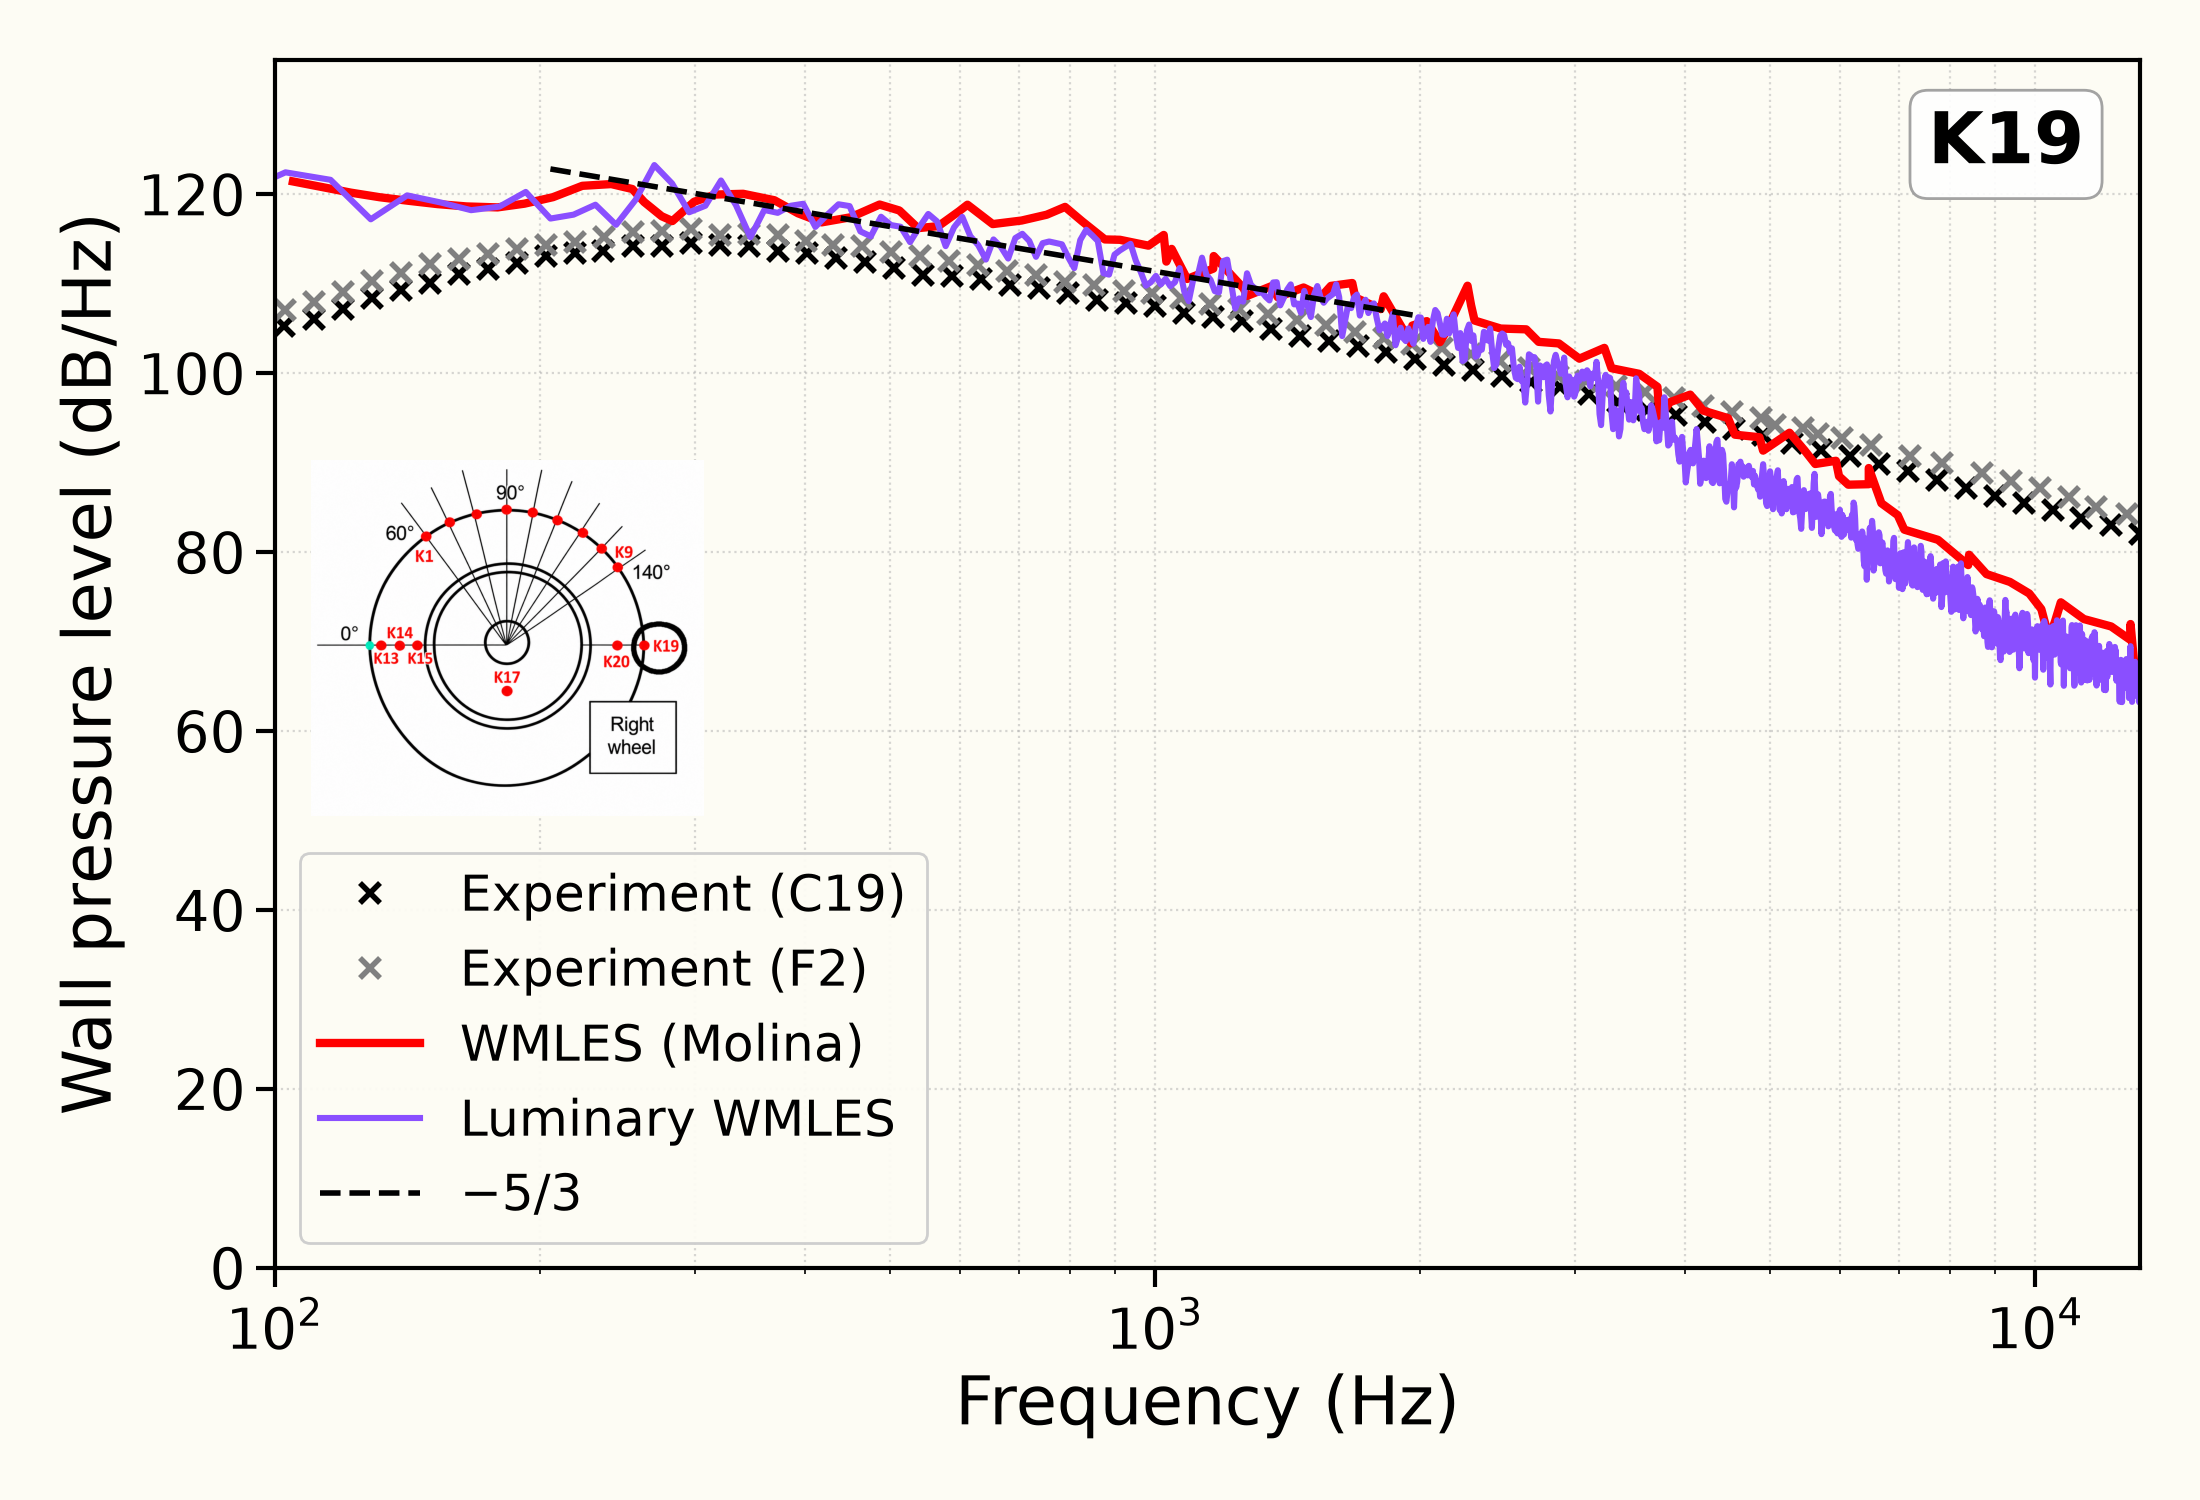
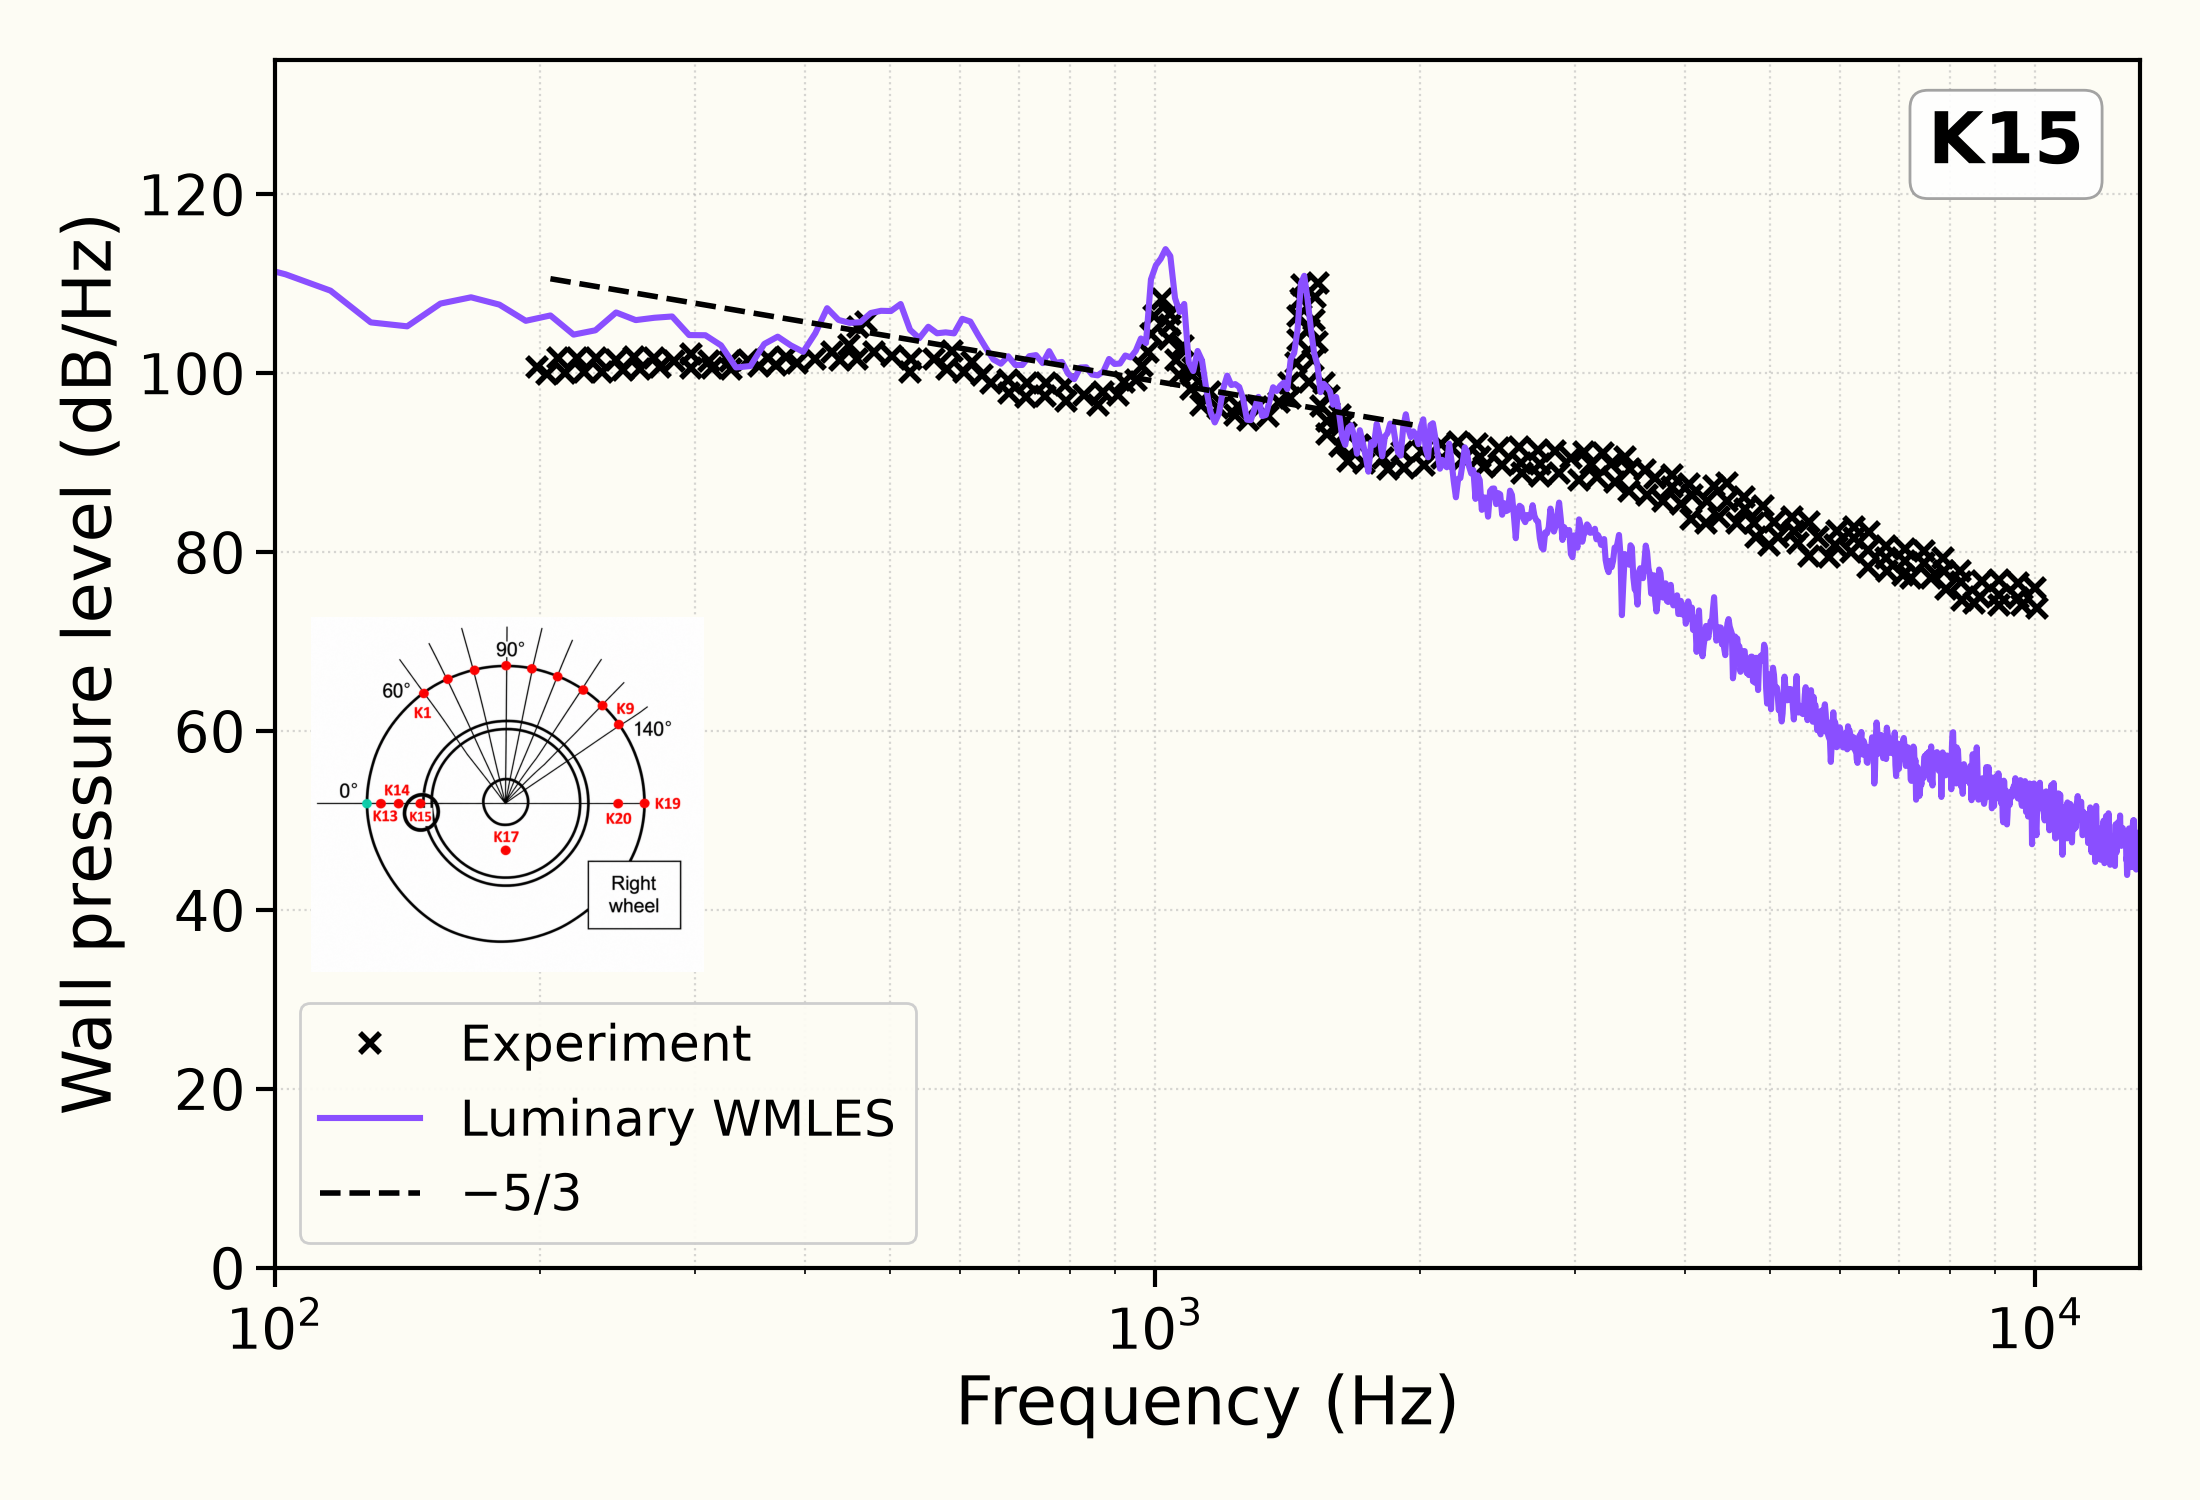
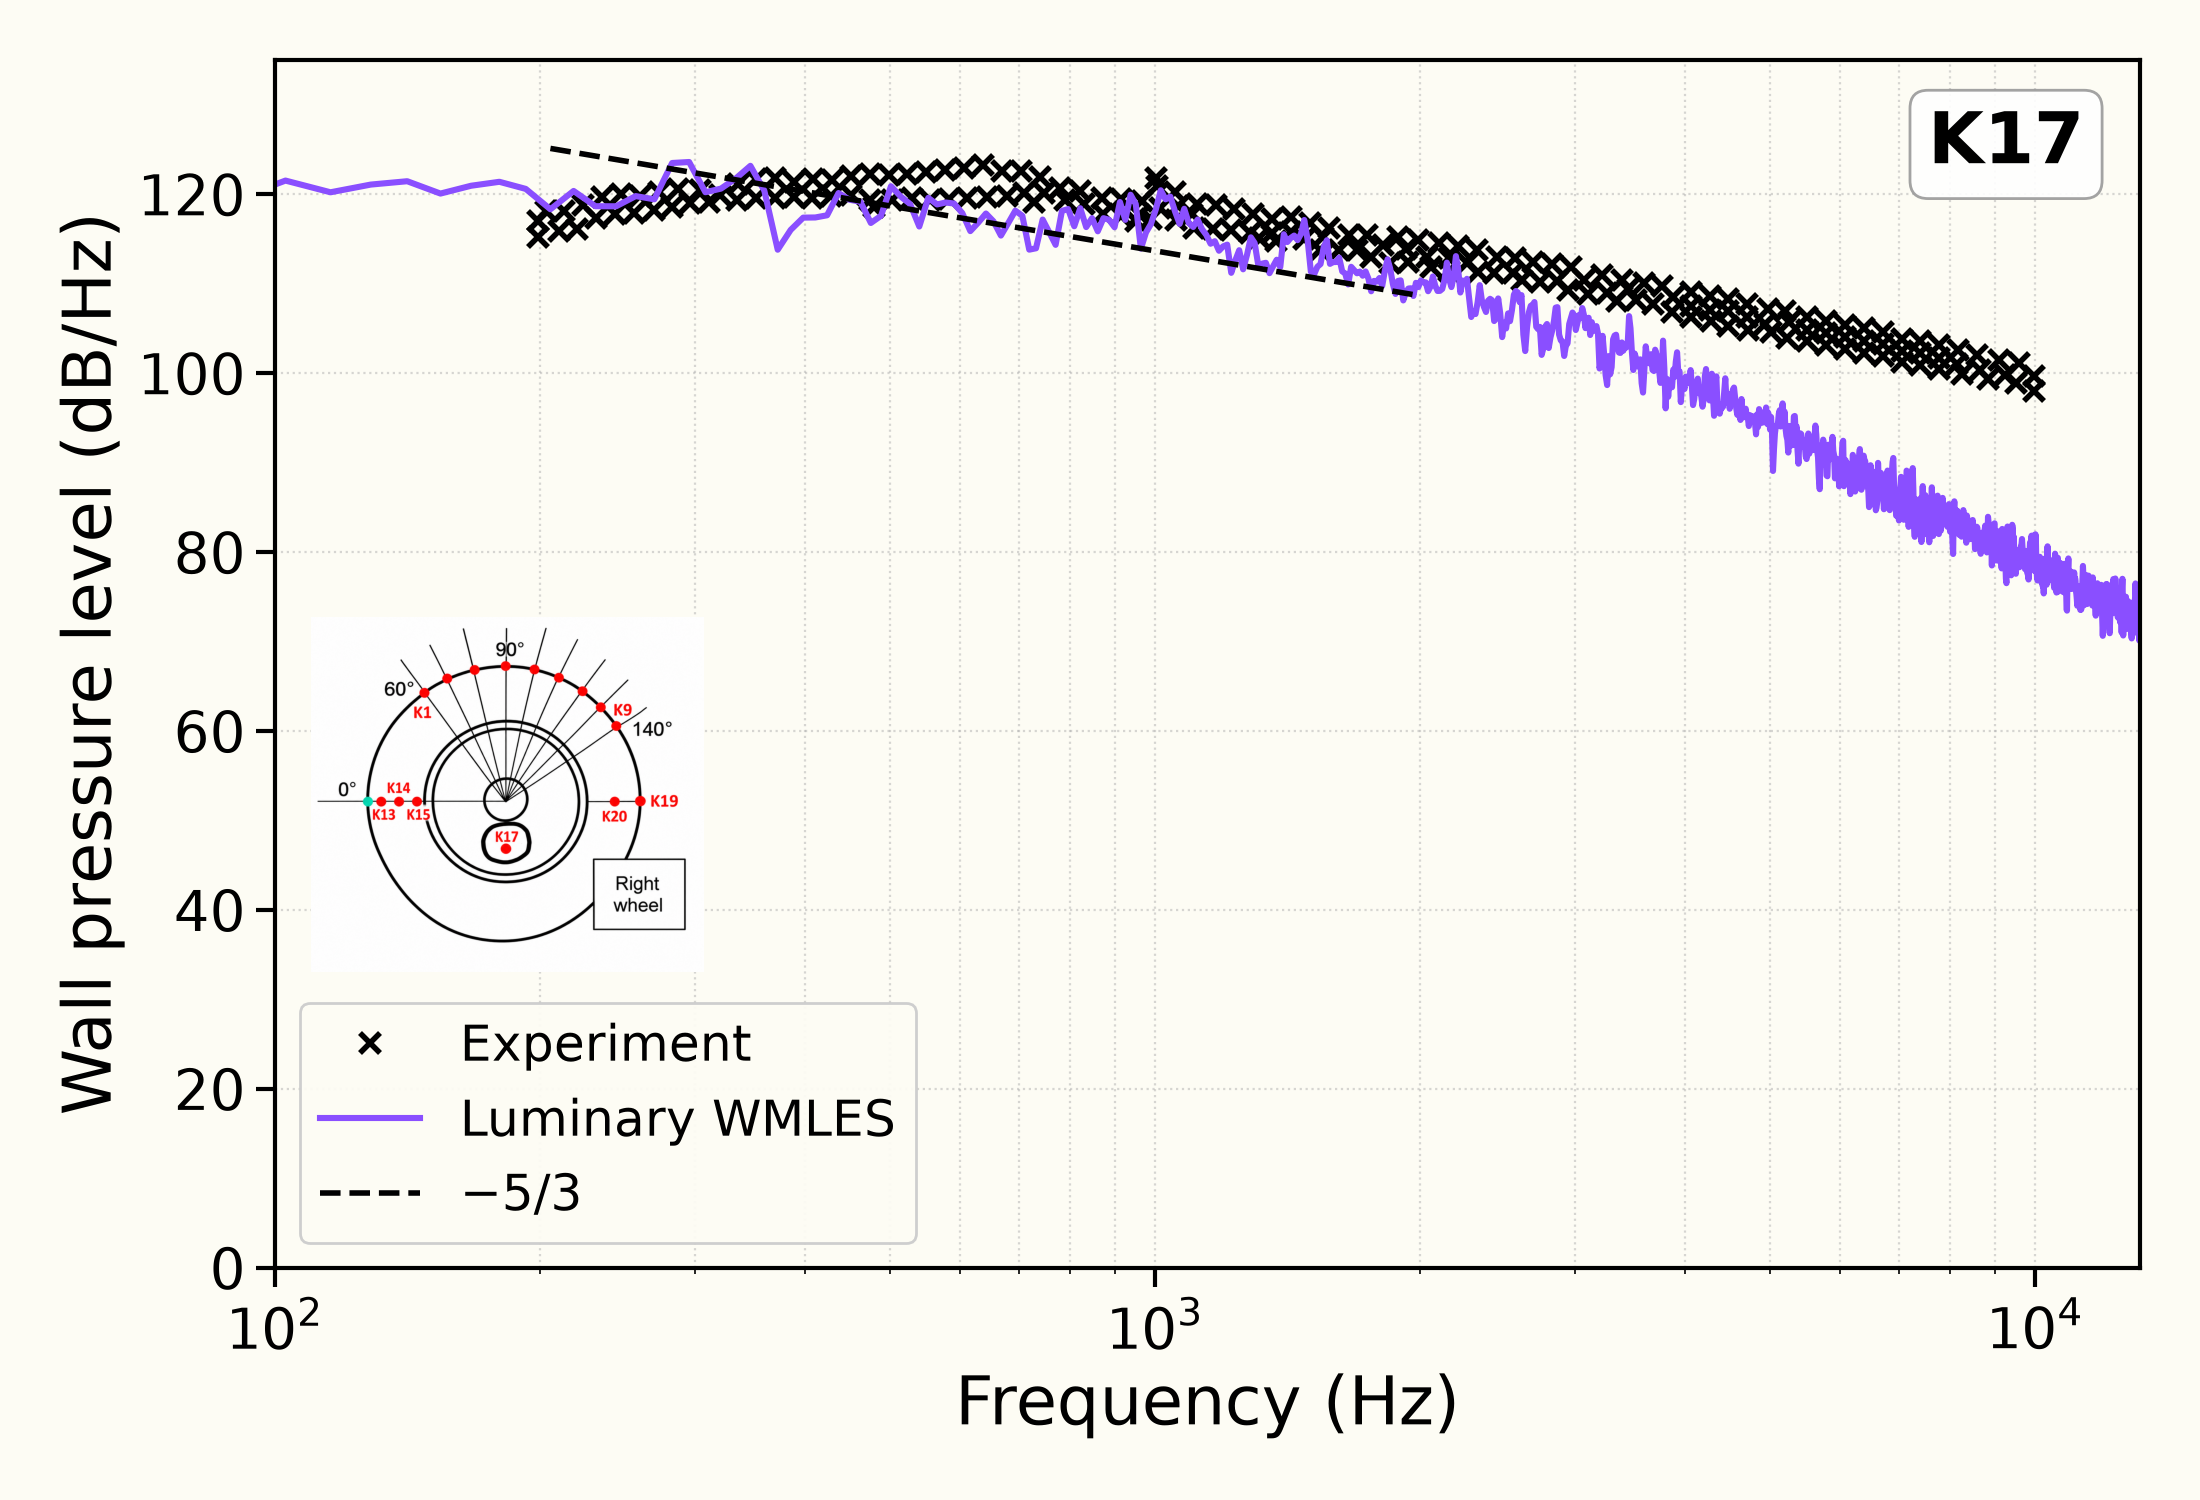
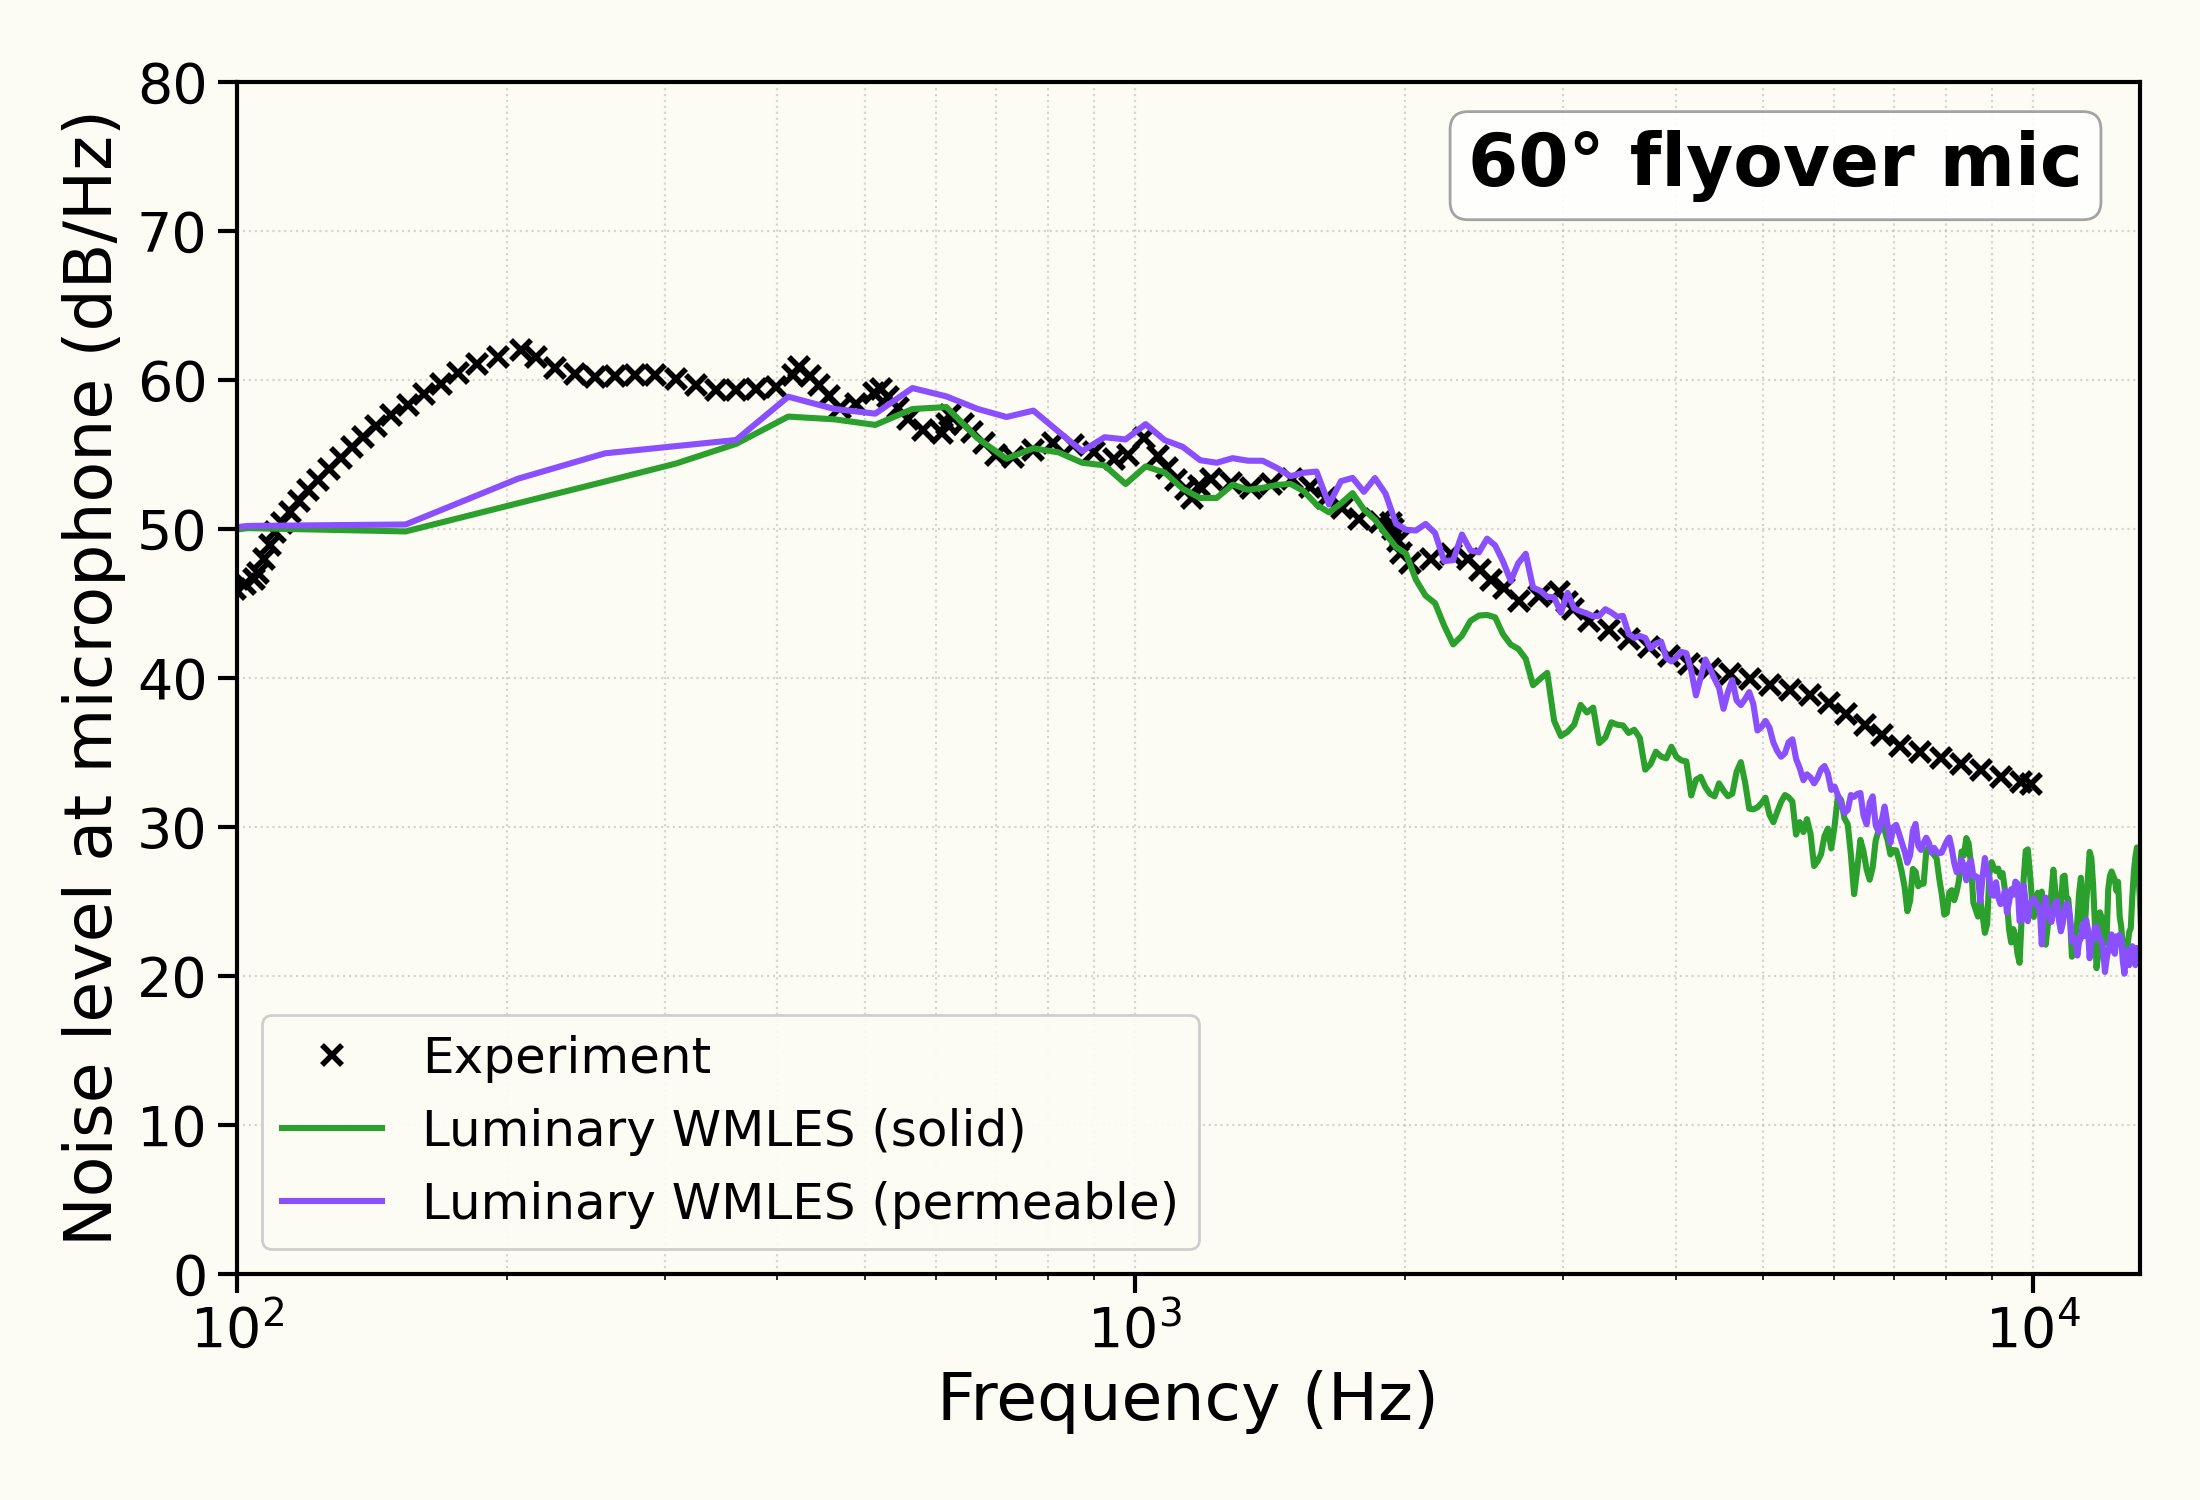
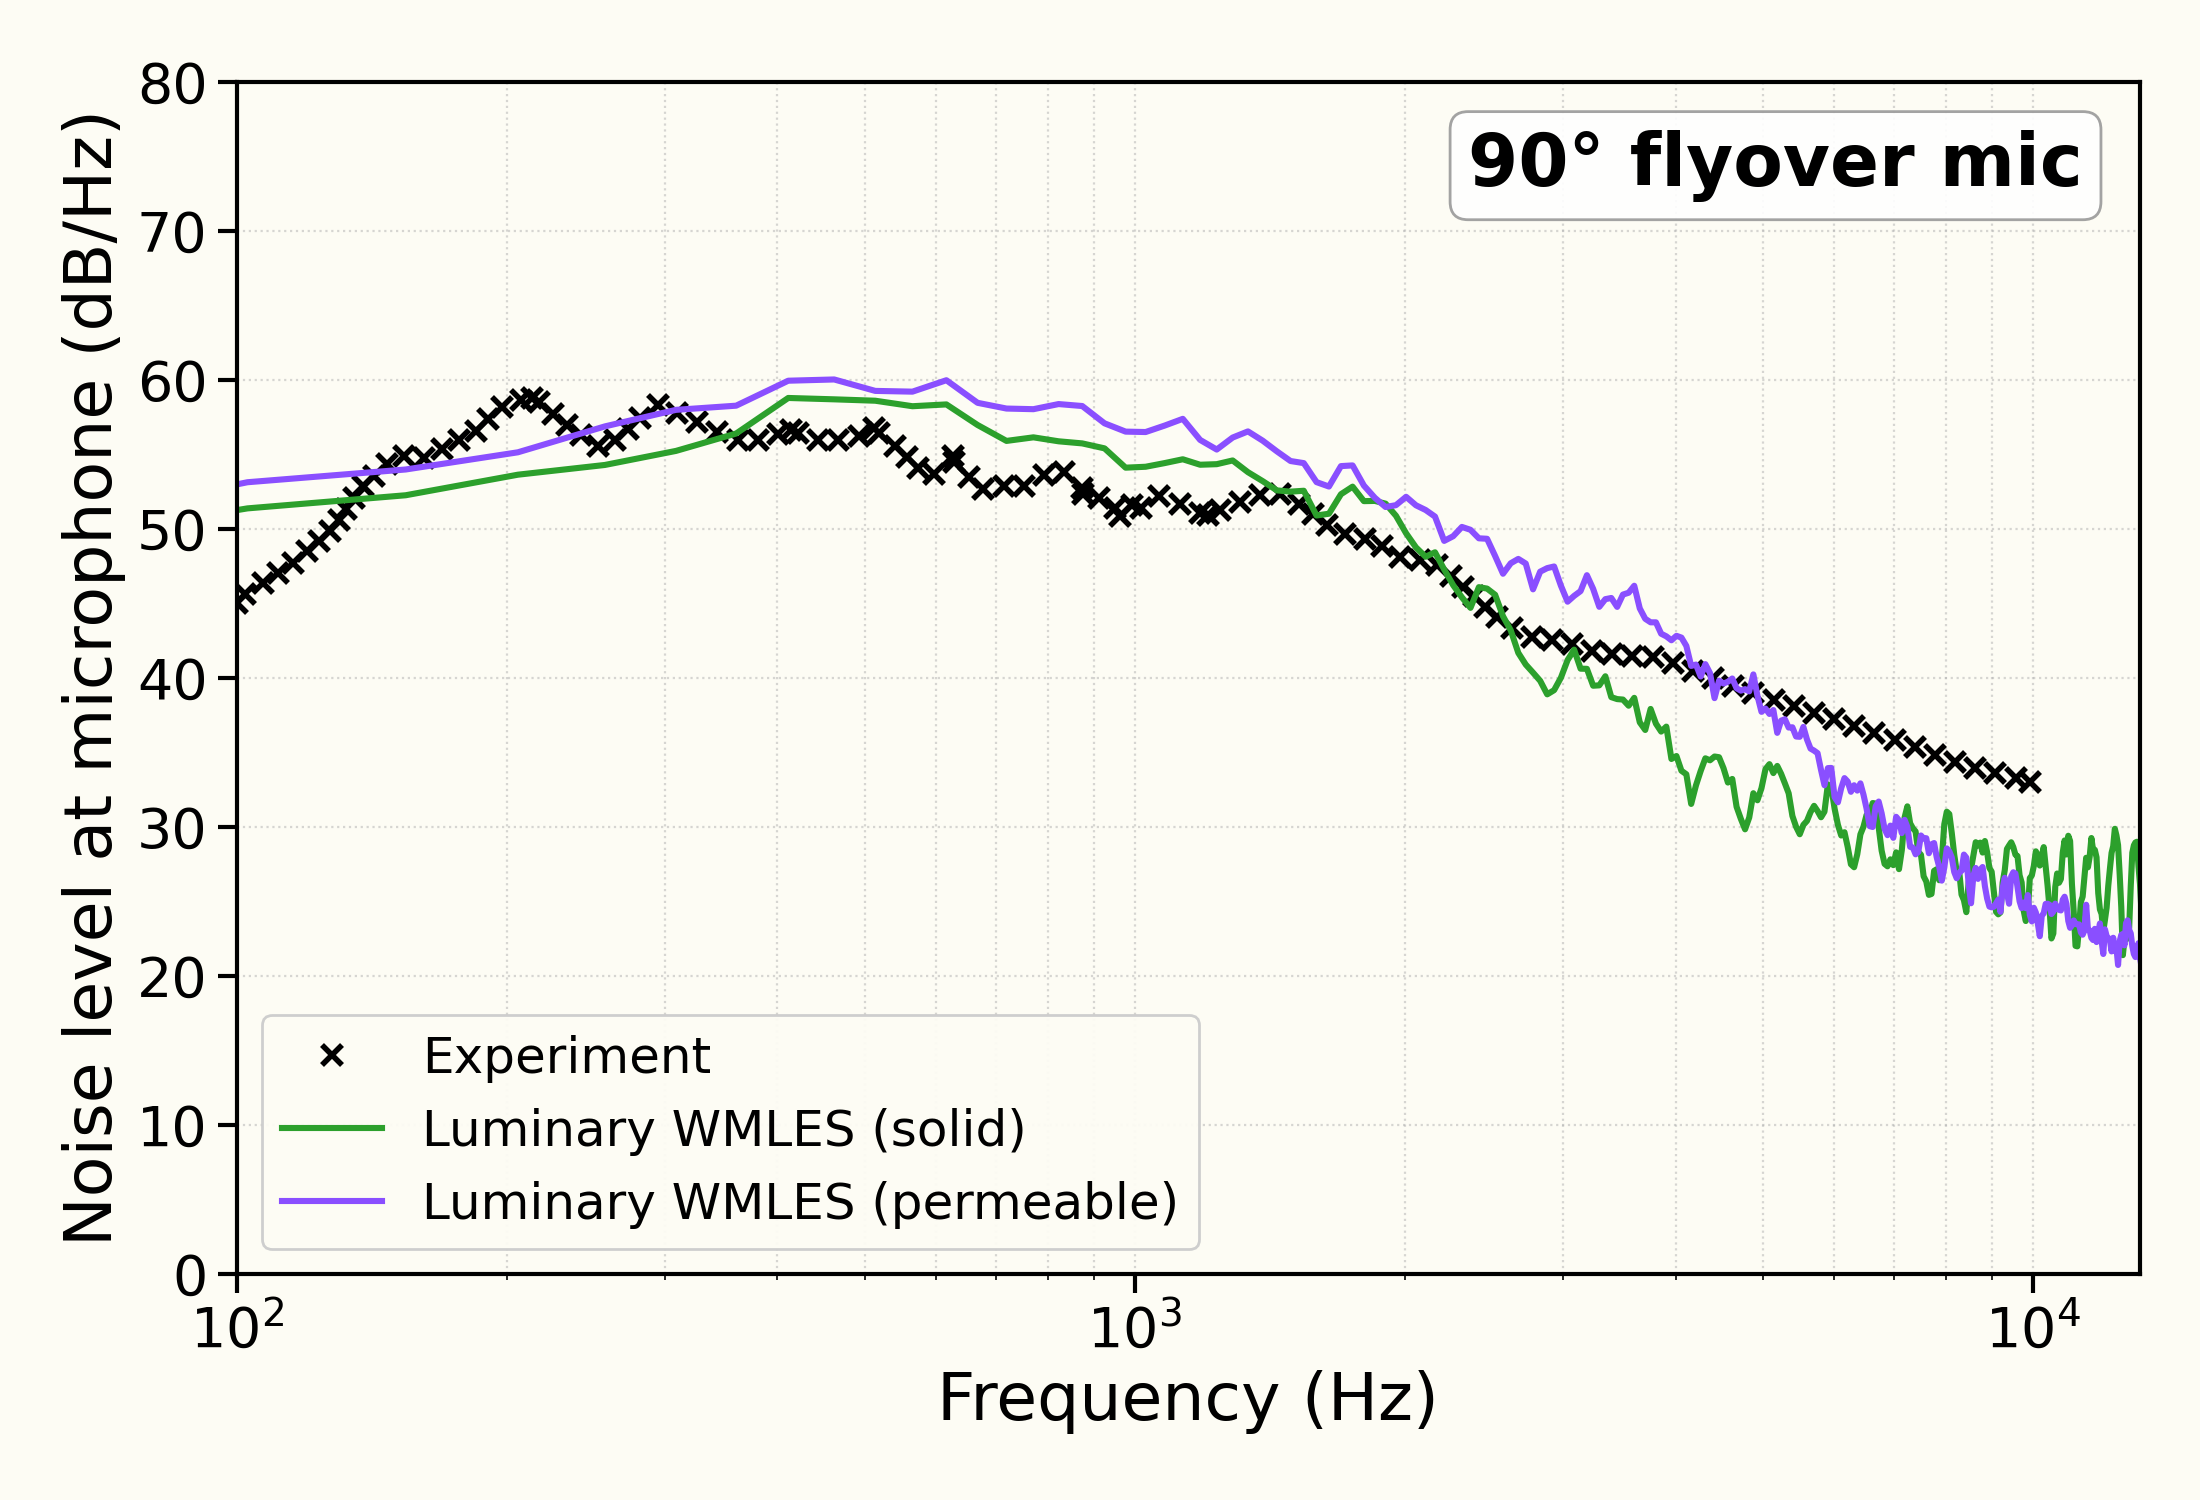
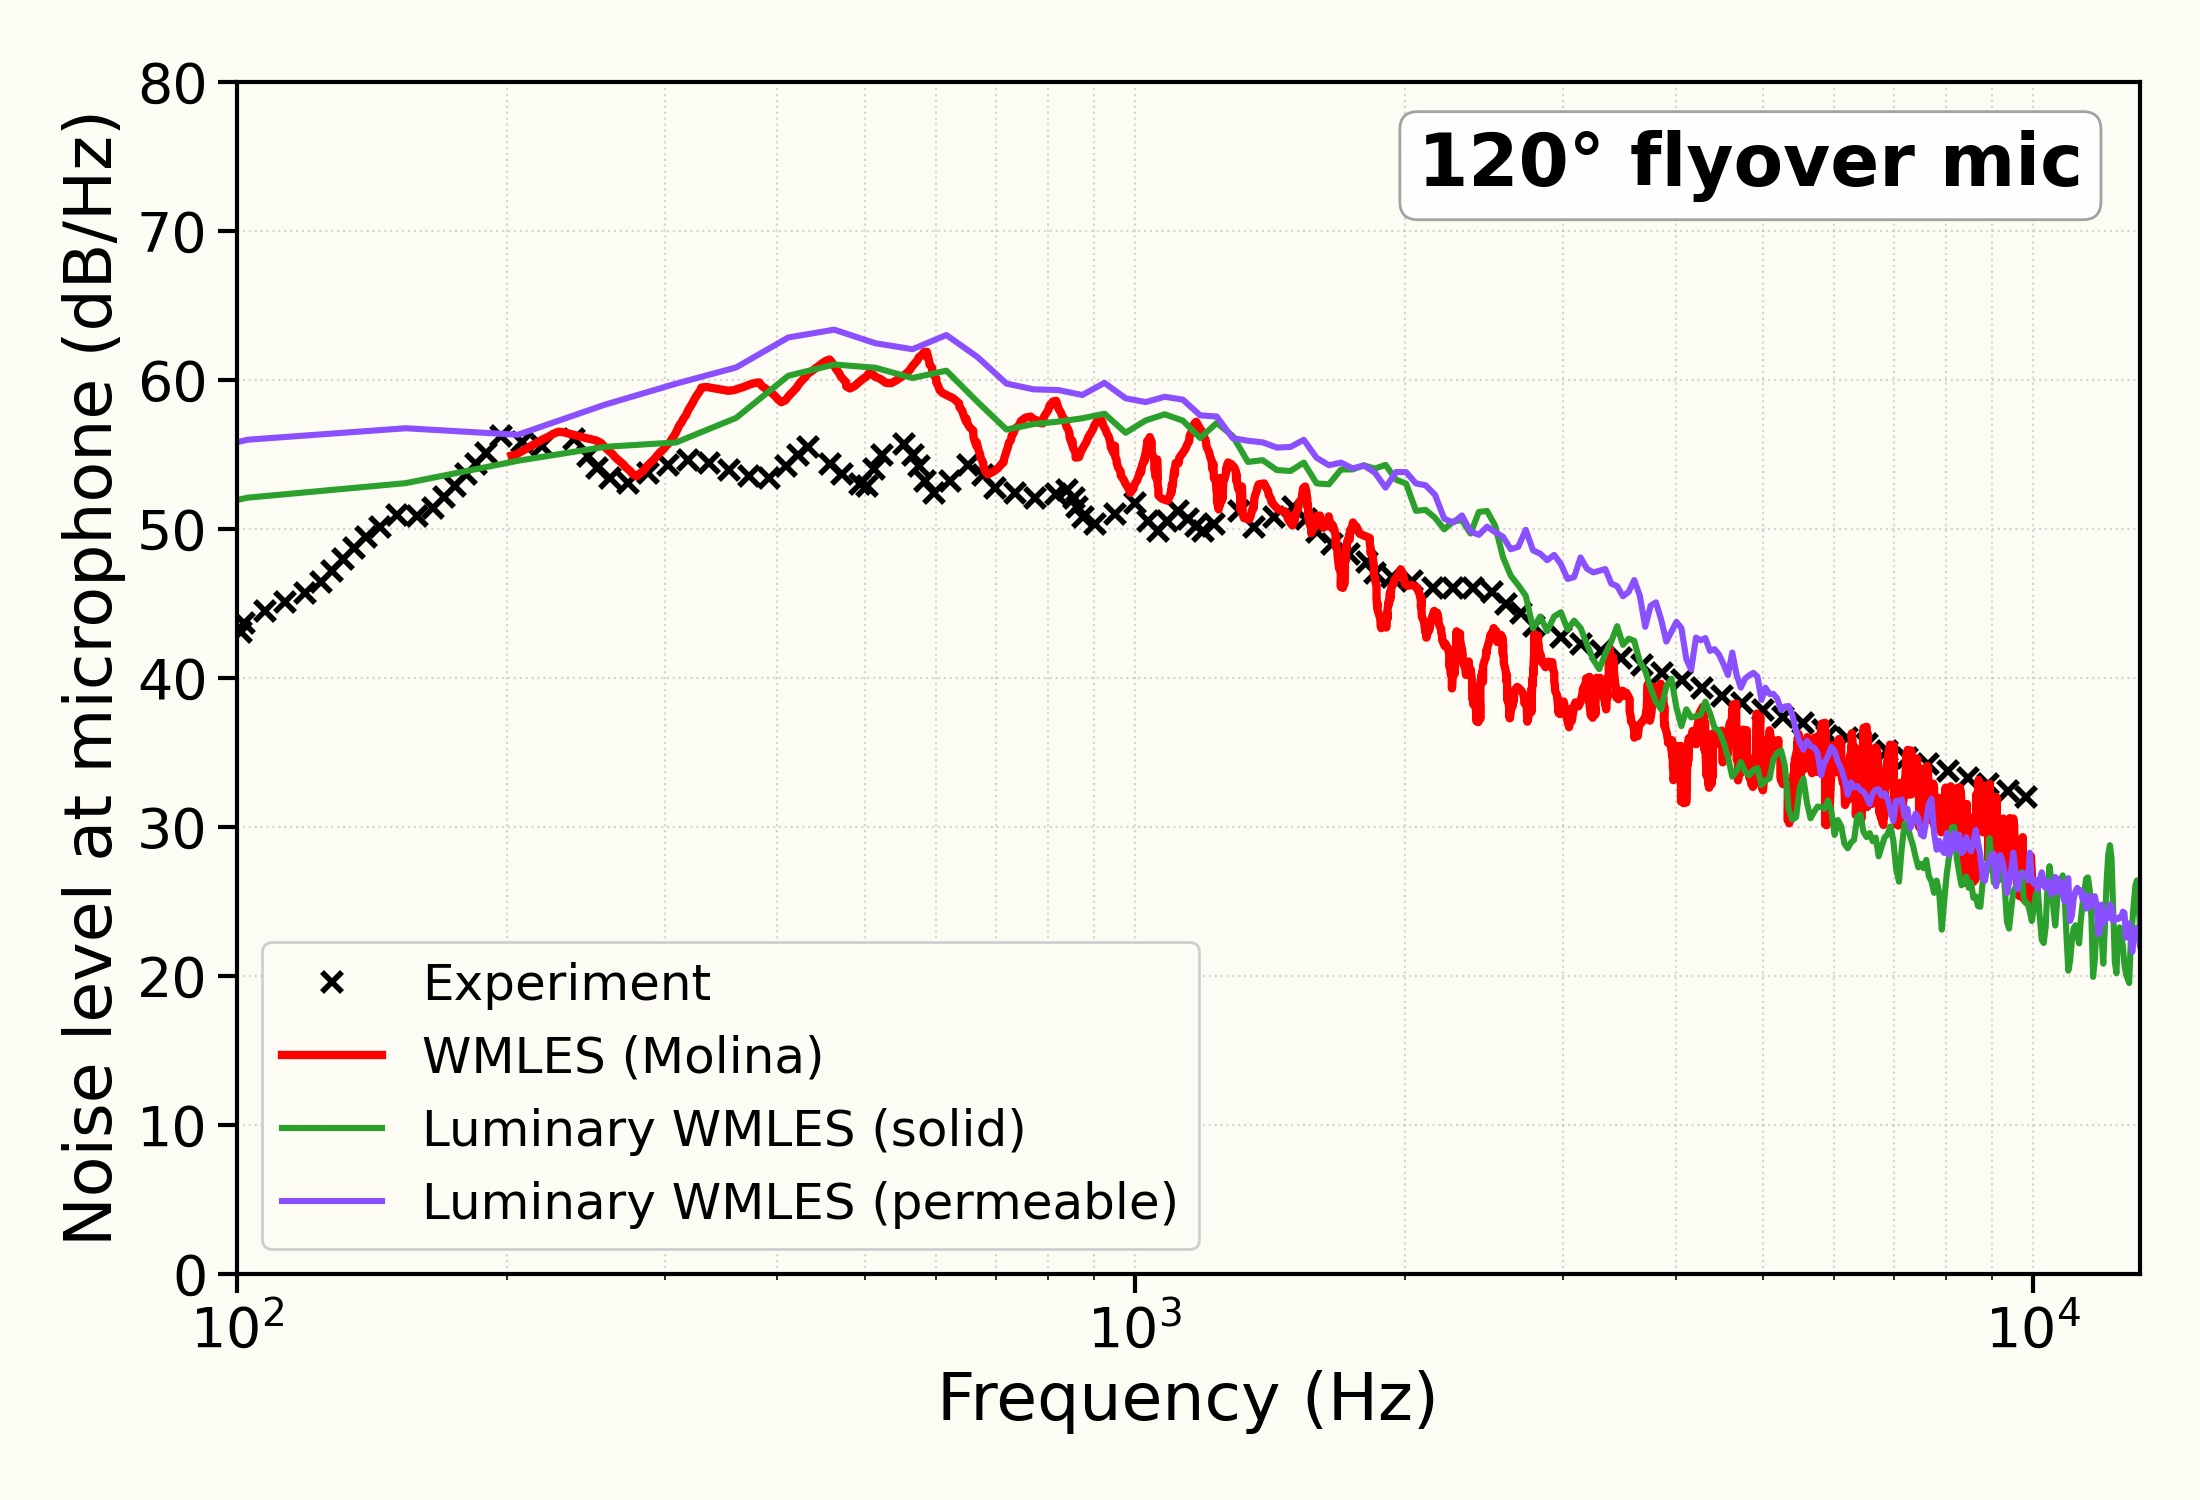
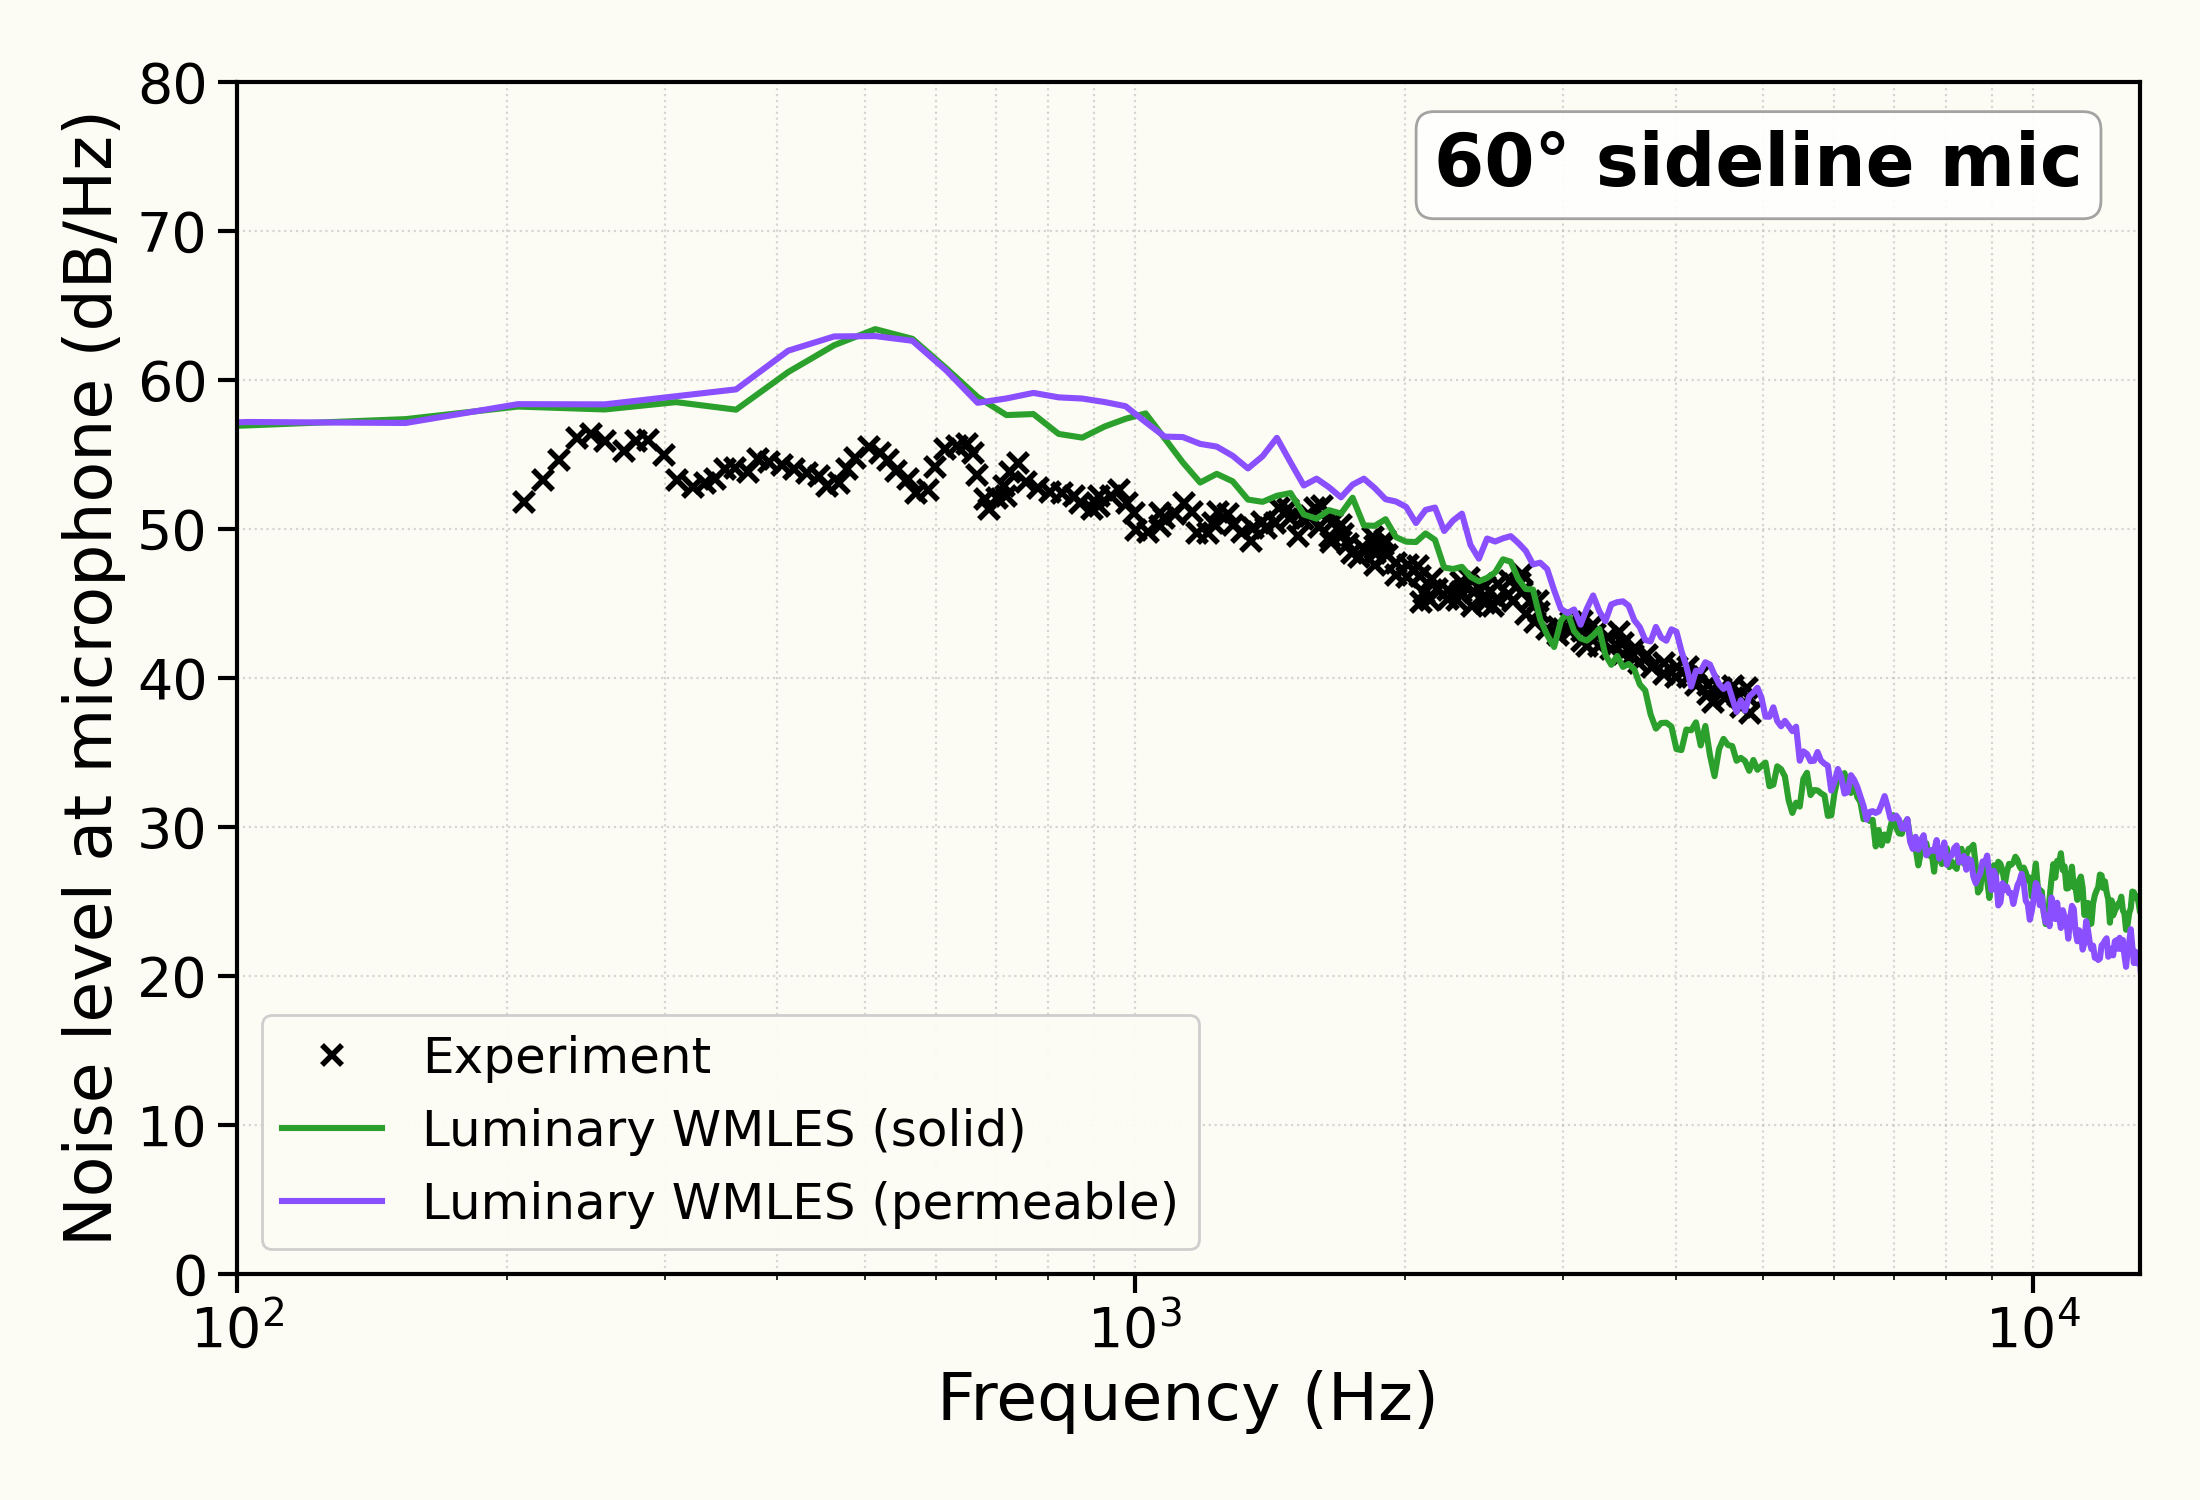
The far-field pressure spectra at the , and flyover and sideline observers, from the gear wall and from the permeable surface; the wall-pressure spectra at the kulite taps K9, K19, K1, K15 and K17; the mean pressure coefficient around the wheel; and the mean and RMS streamwise and vertical velocity along a line across the wake, each compared with the measurements of Manoha et al. (2008, 2009). The flyover spectrum and the spectra at K9 and K19 are also compared with the wall-modelled large-eddy simulation of Molina (2021). The velocity spectra at three points in the wake are shown against a power law.
Sources
Results
Mean pressure coefficient around the wheel
Mean velocity in the wake
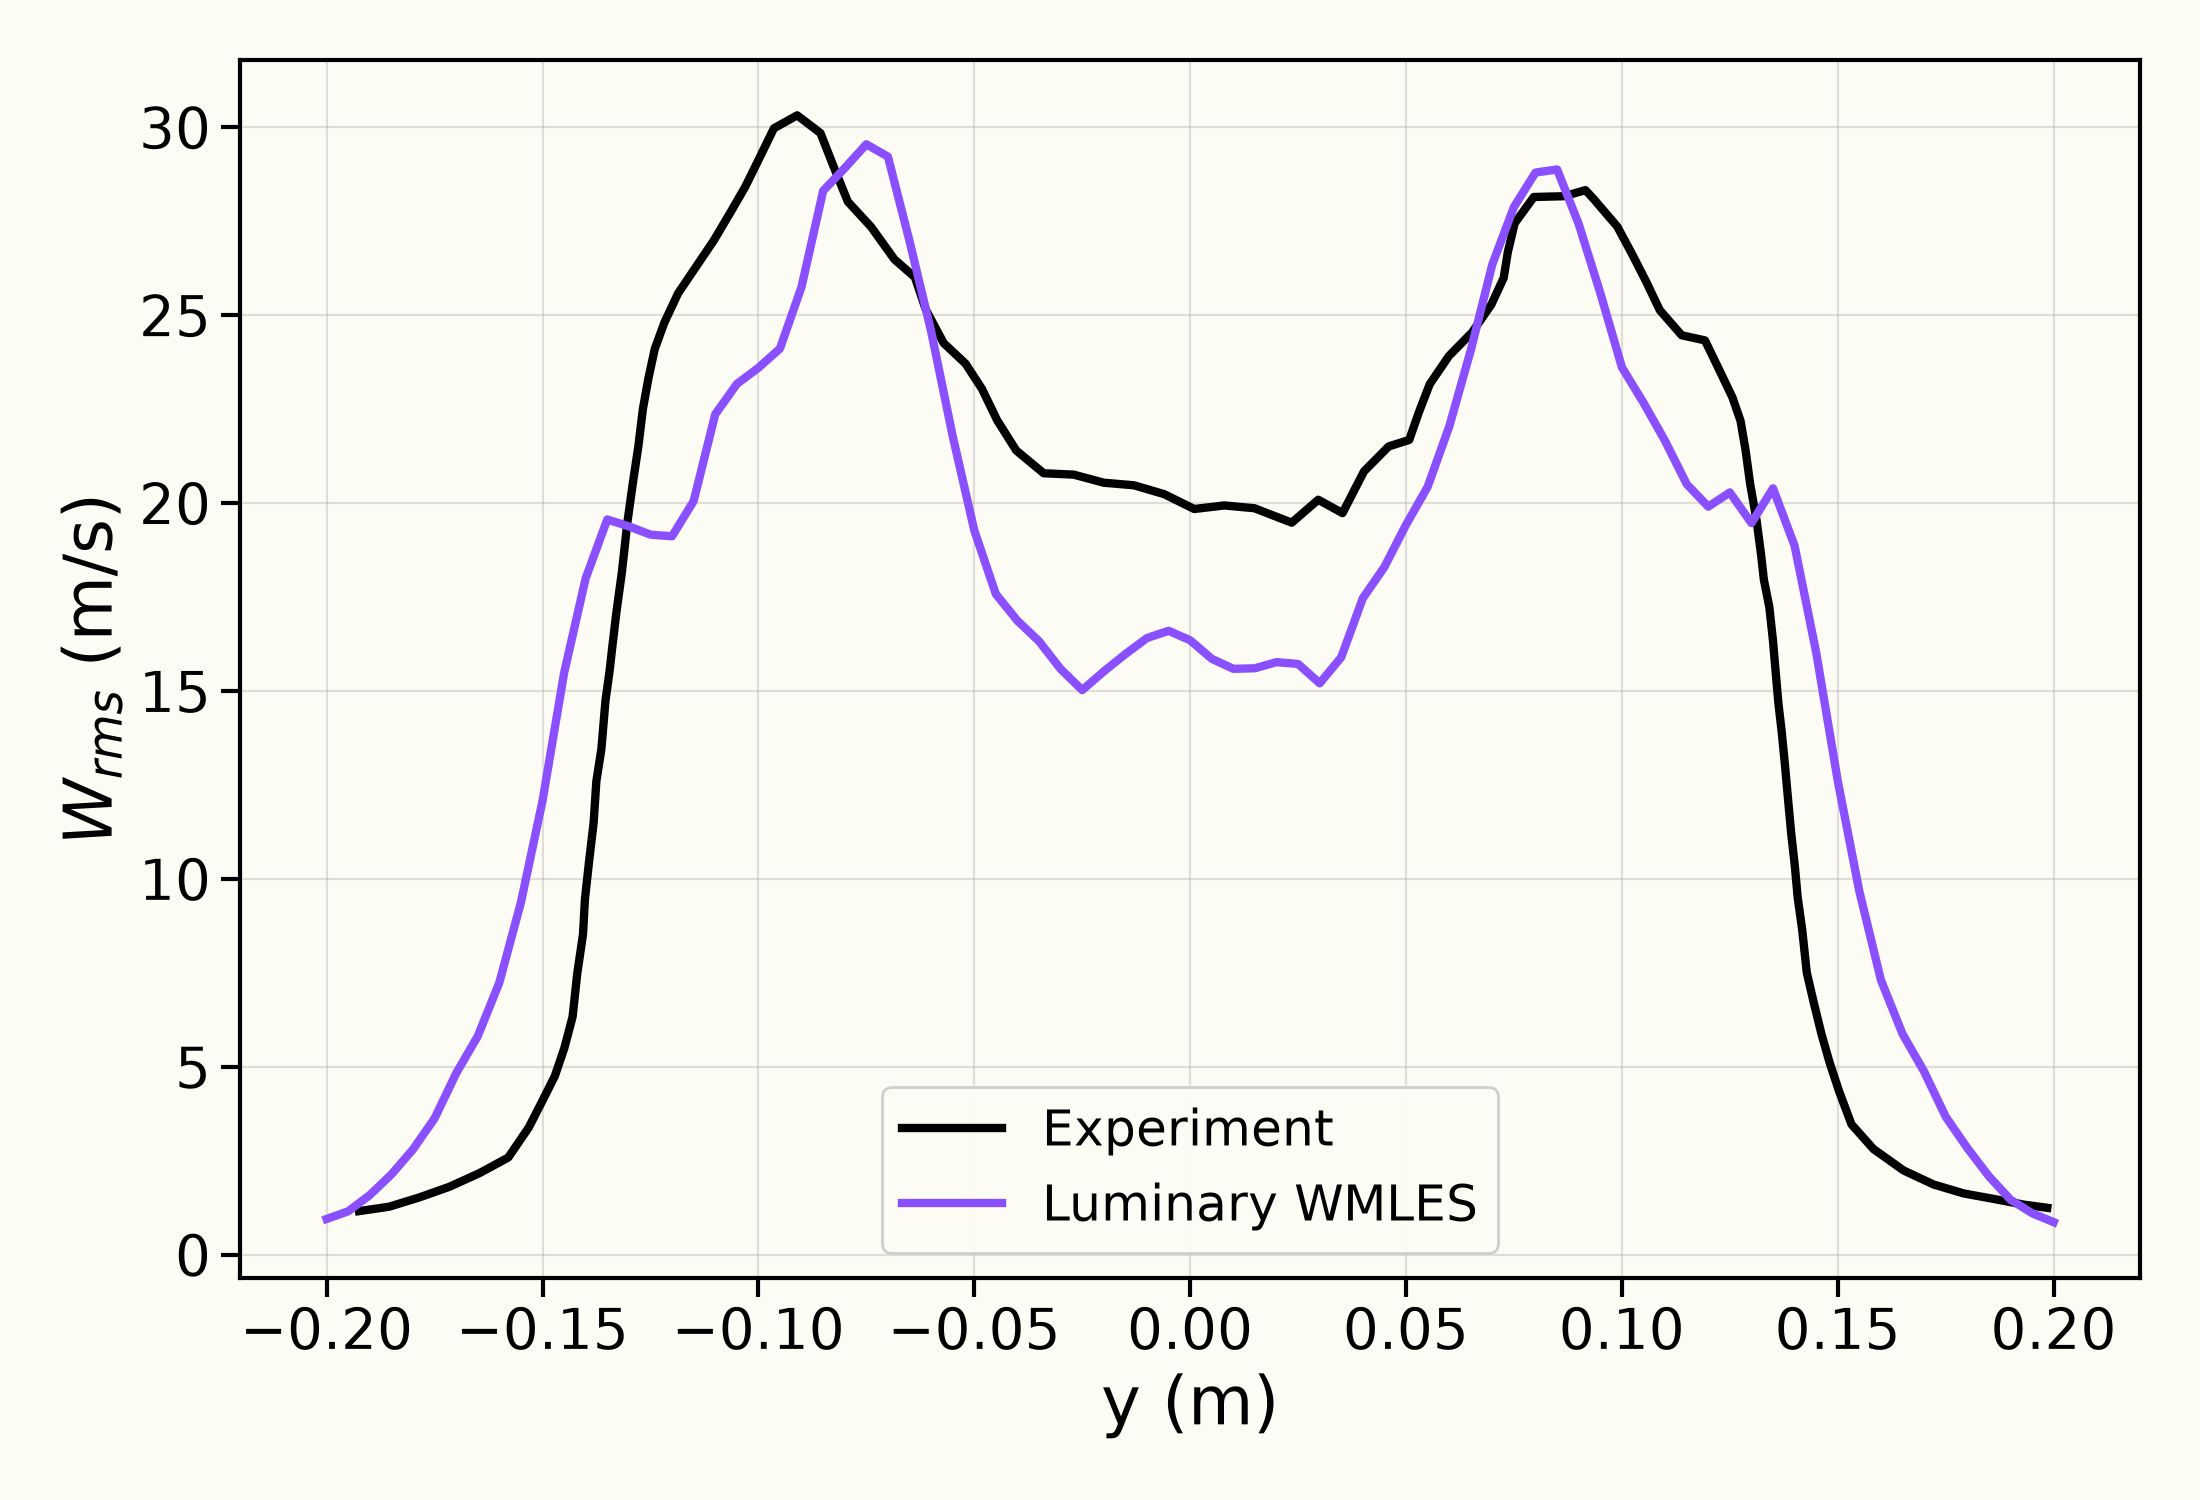
RMS velocity in the wake
Wake velocity spectra
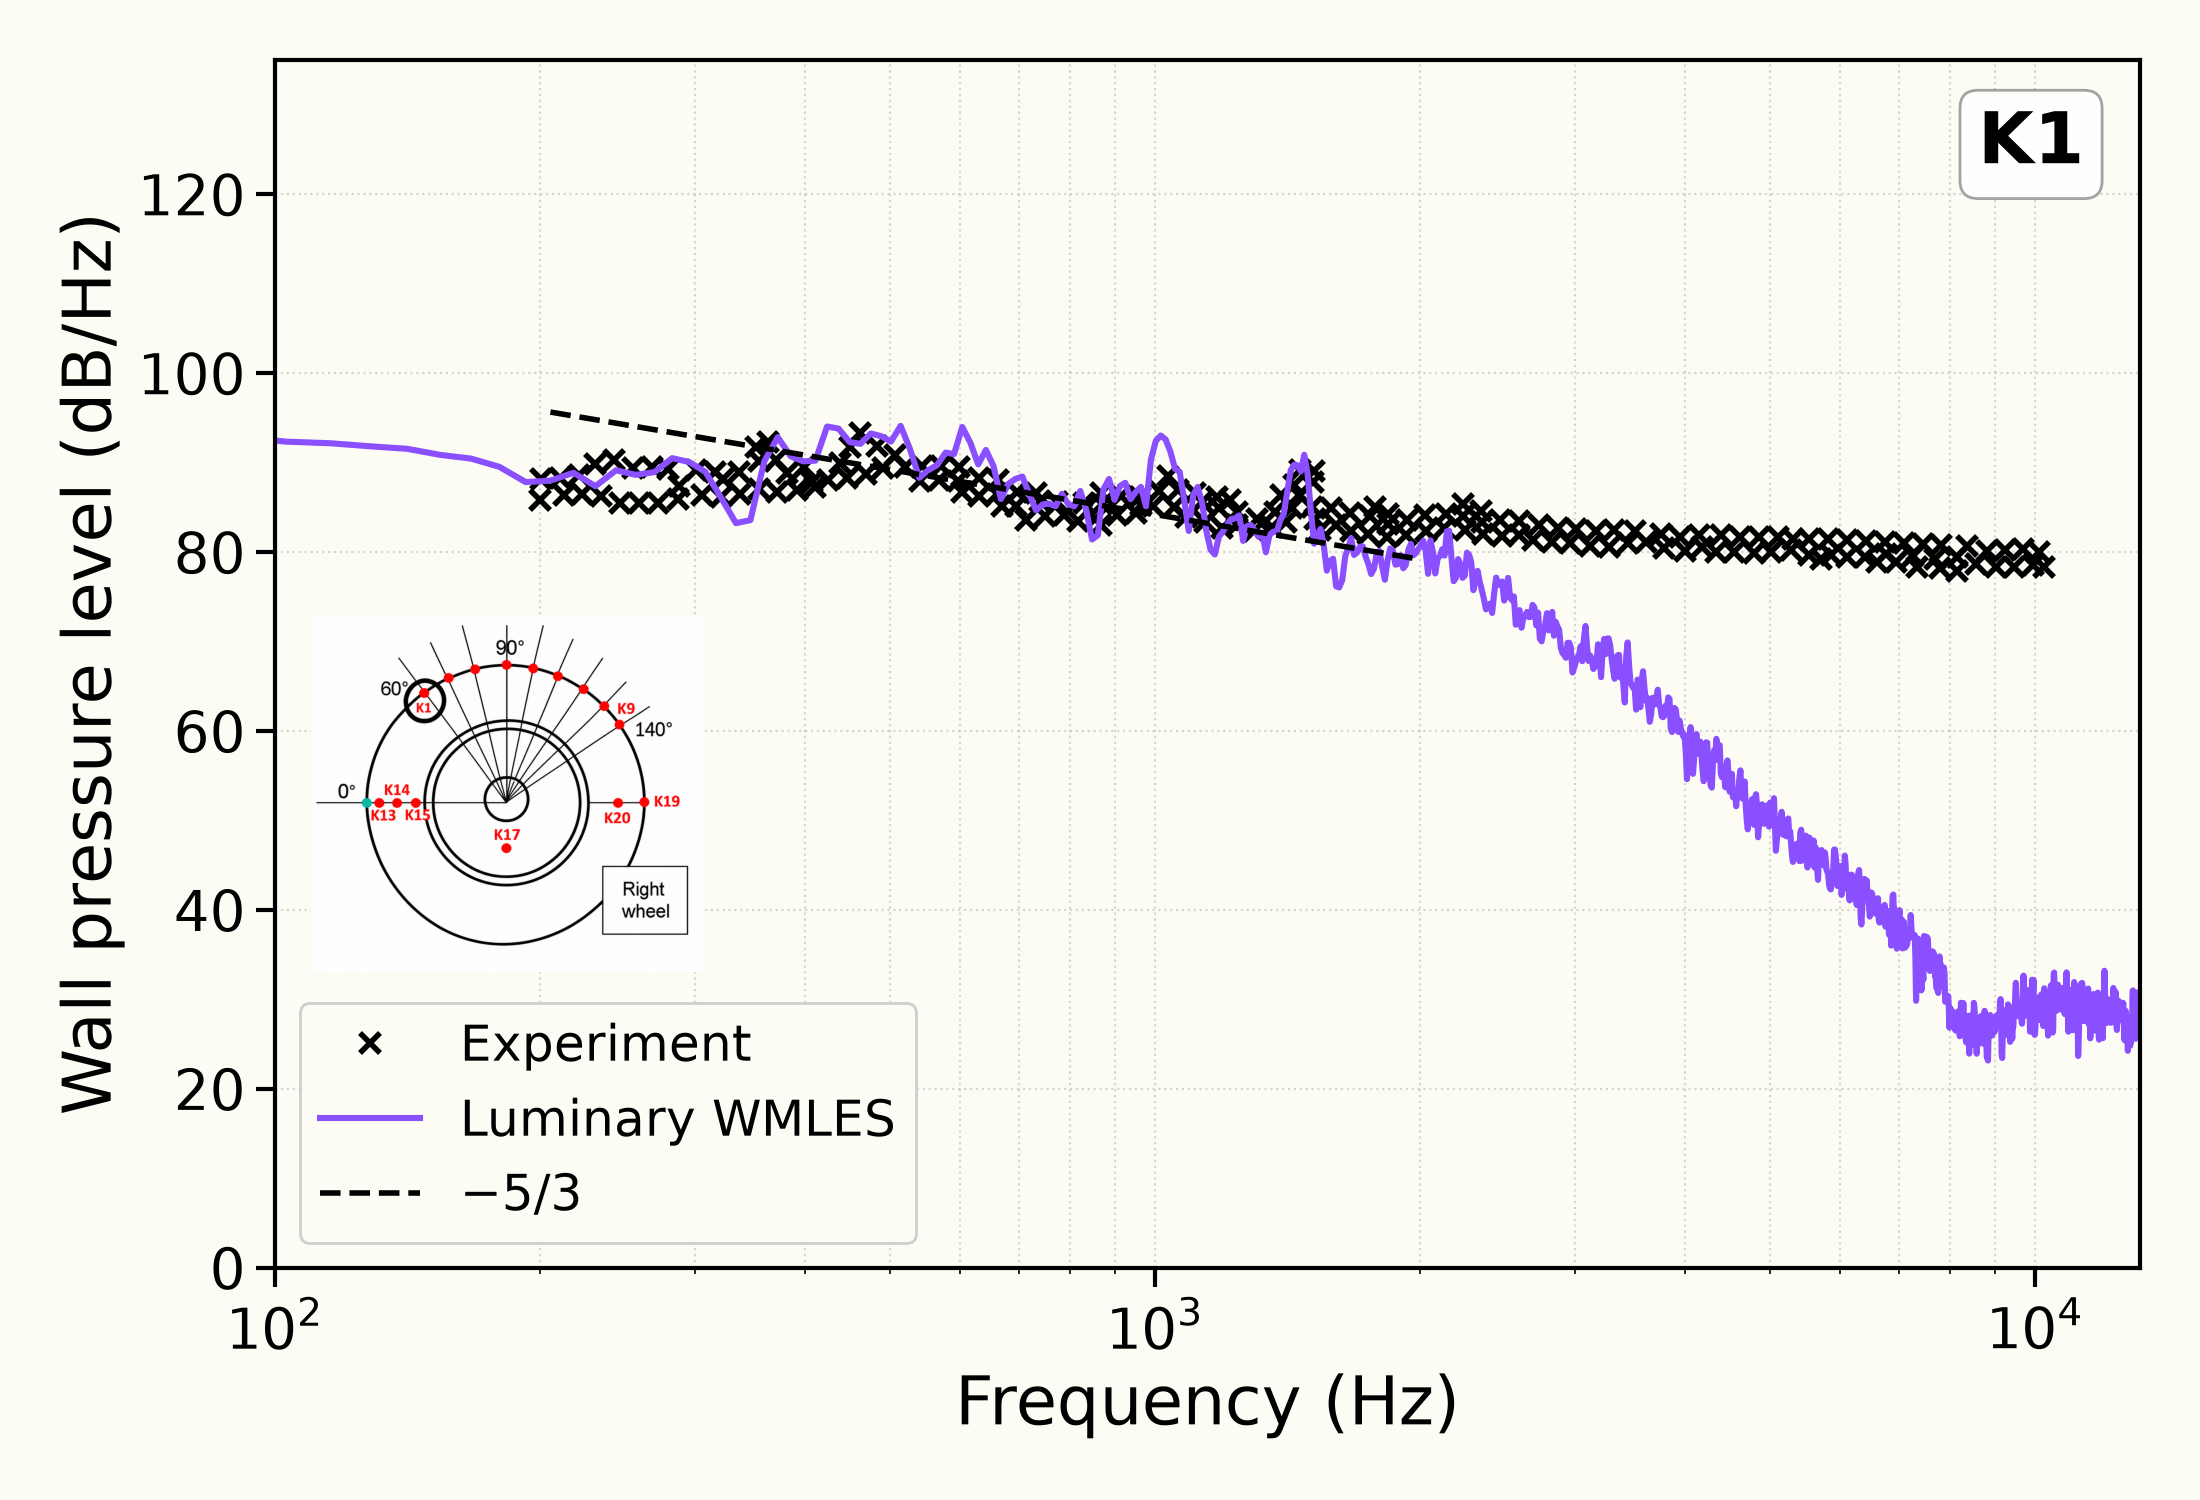
Wall-pressure spectra at K1, K9 and K19
Wall-pressure spectra at K15 and K17
Far-field spectra at the flyover observers
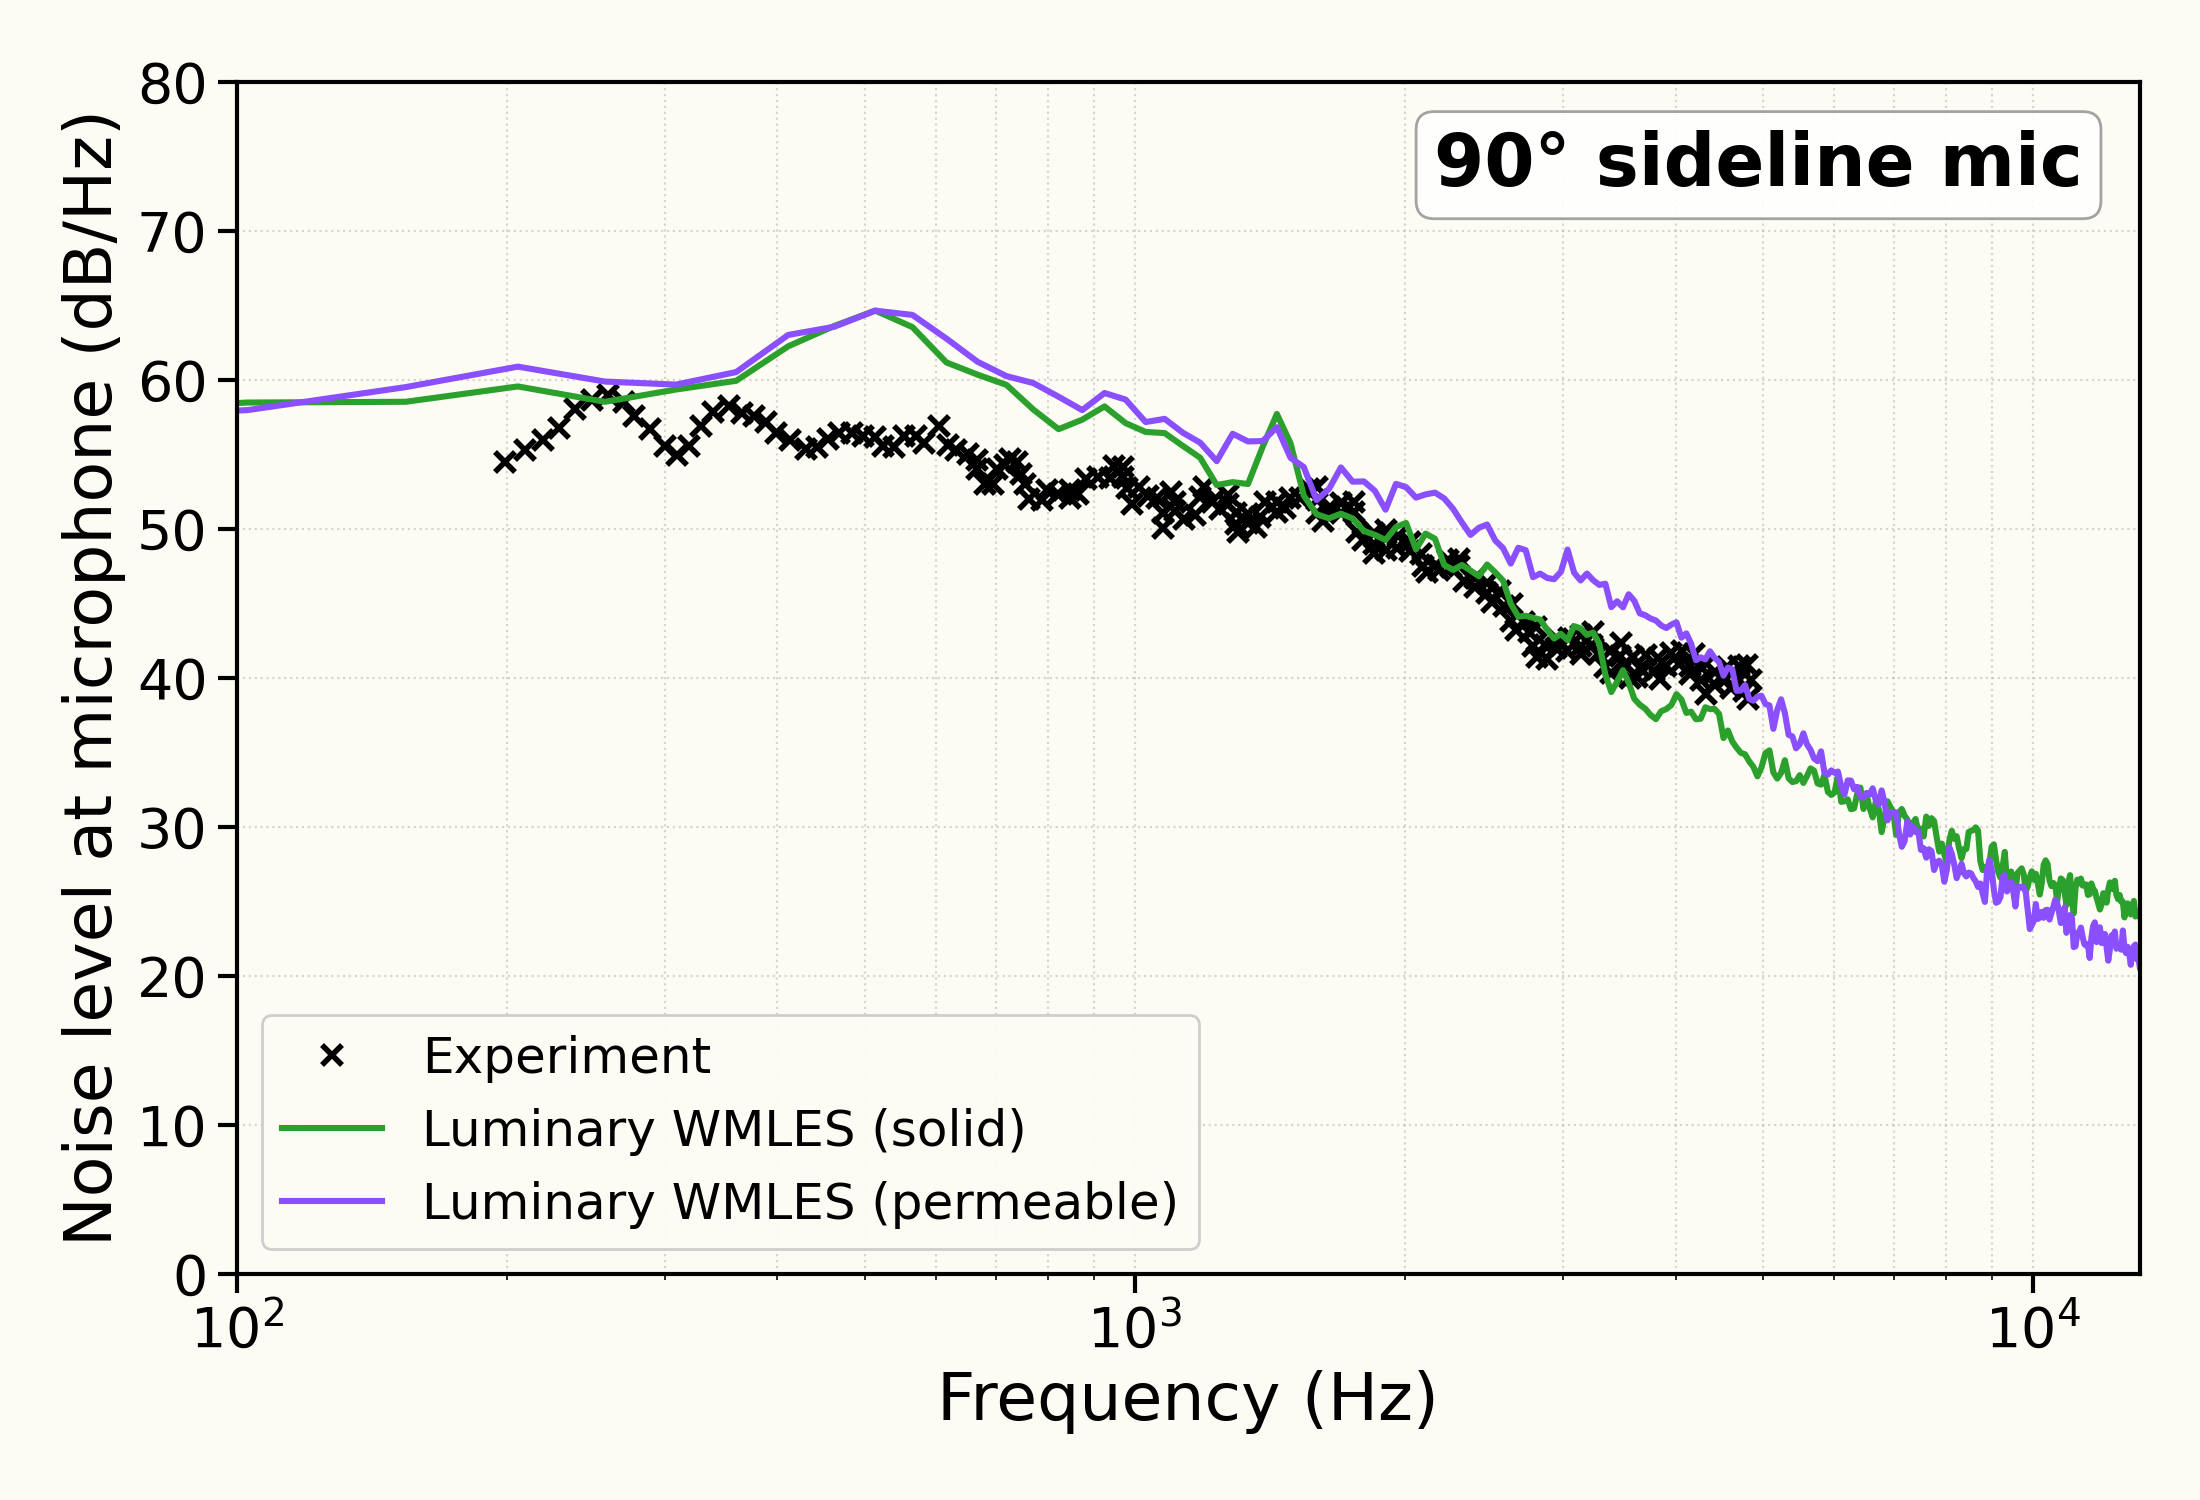
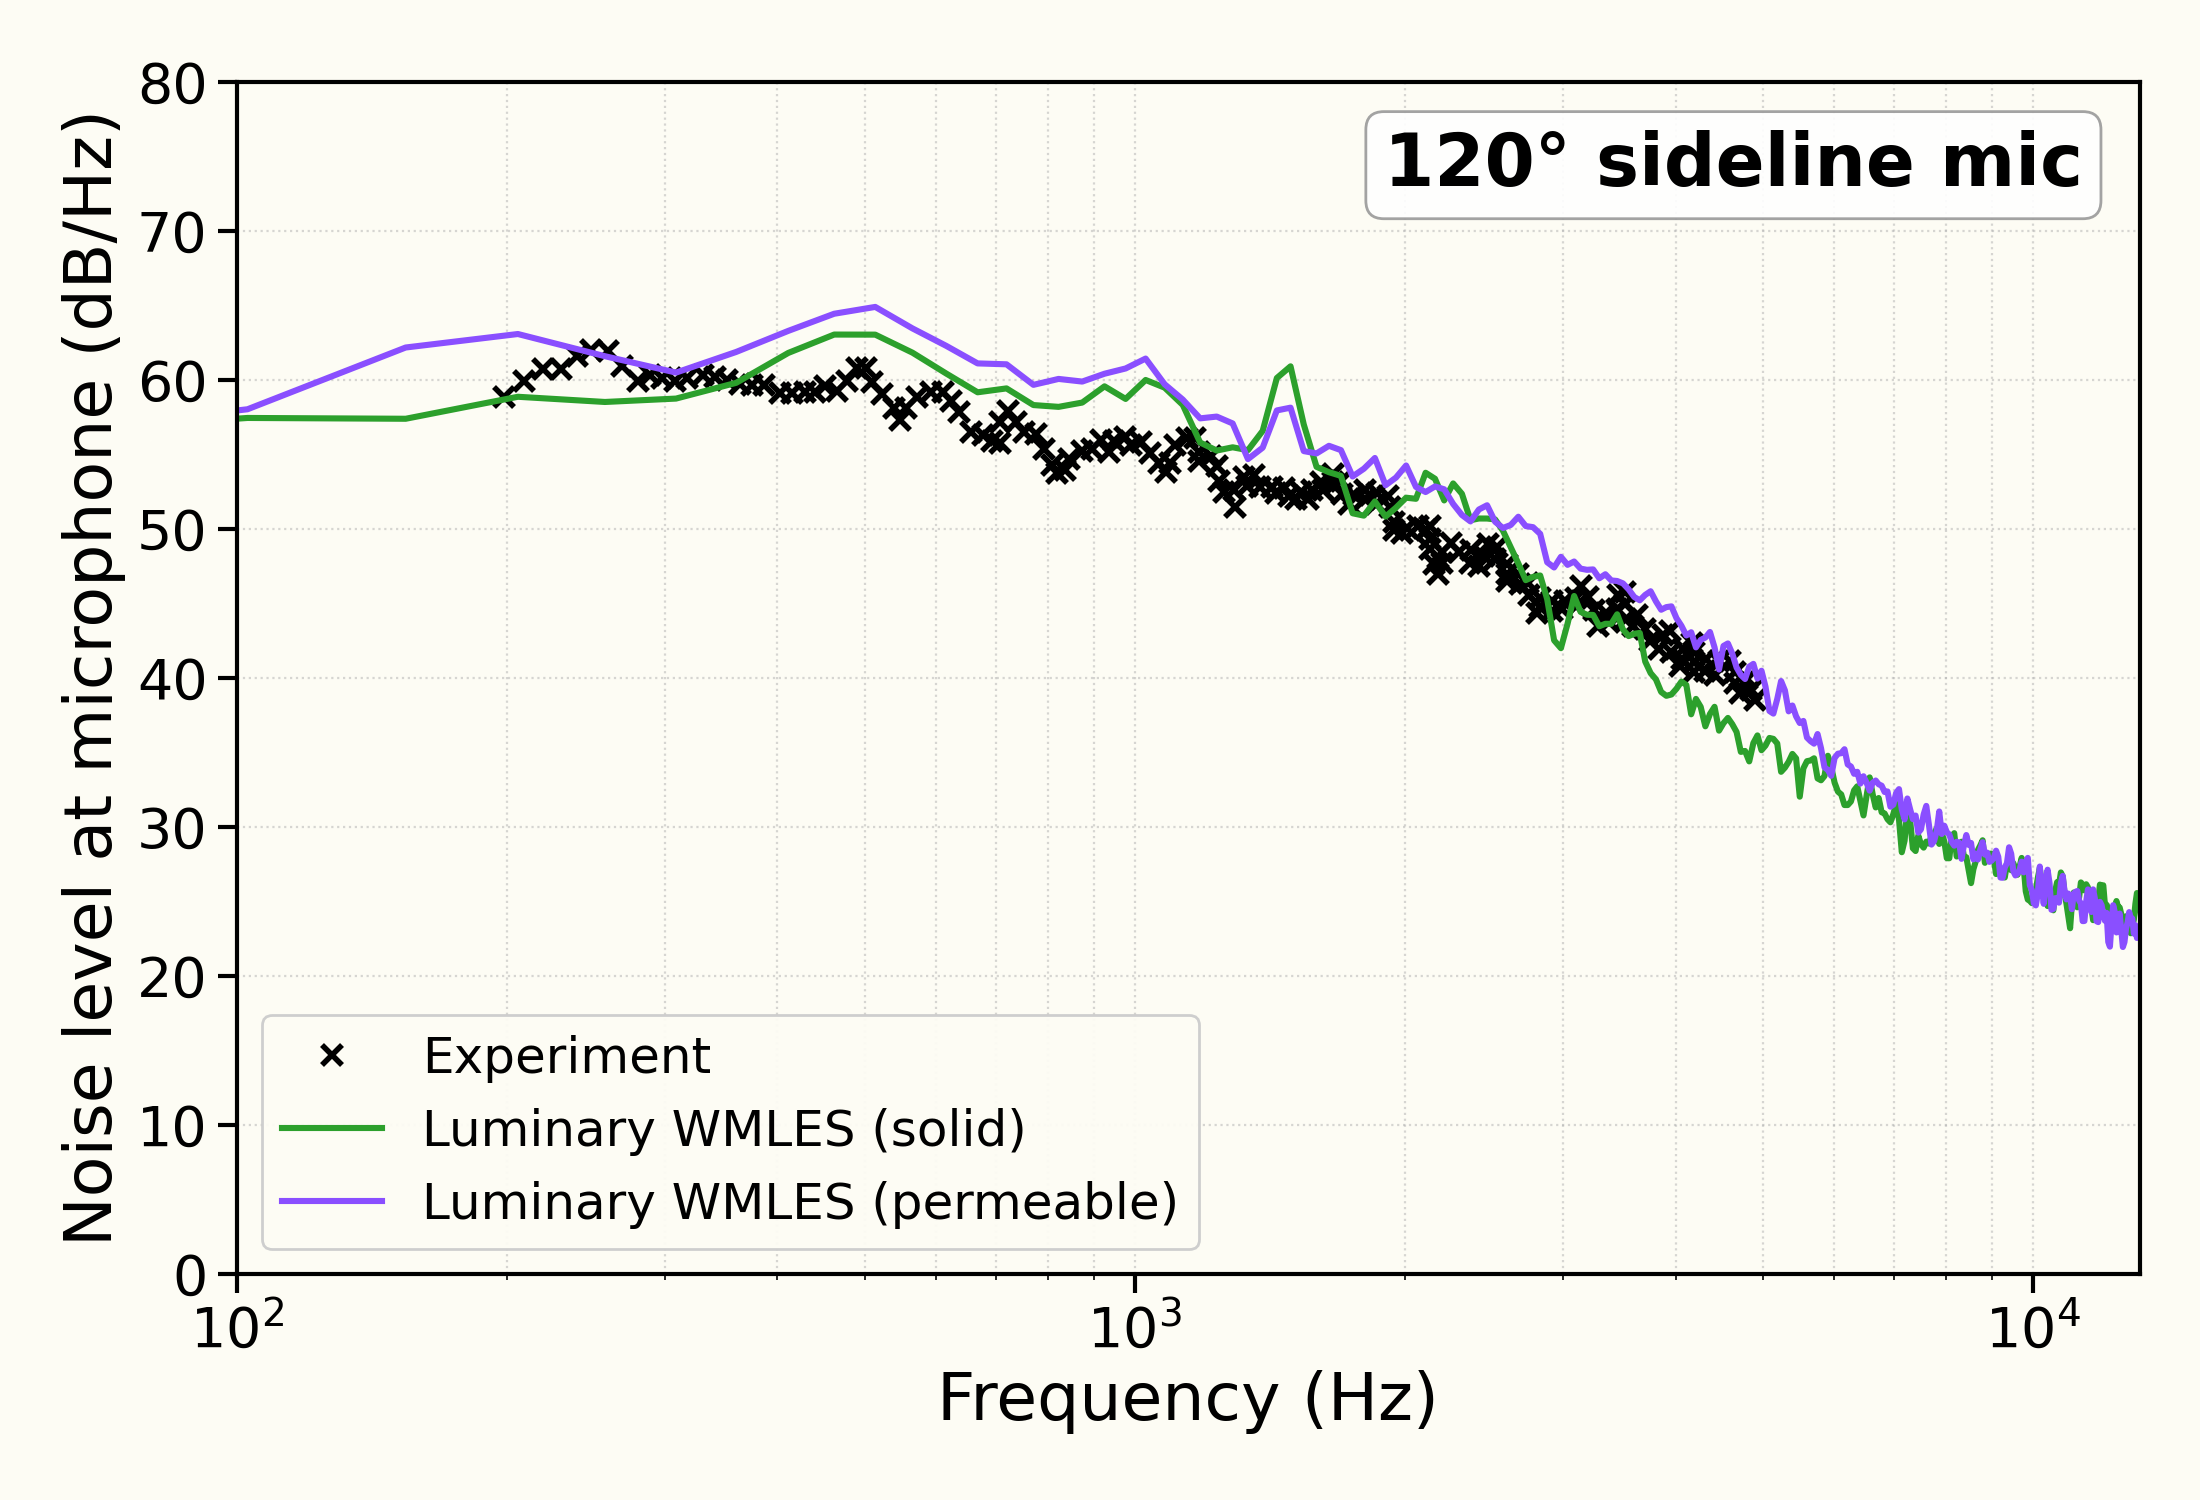
Far-field spectra at the sideline observers
Discussion
A landing gear has no single dominant tone. Its noise is a broad hiss from the turbulent wakes of the wheels, the axle and the leg, so the comparisons here are spectra: how loud the sound is at each frequency. The spectra are in decibels per hertz.
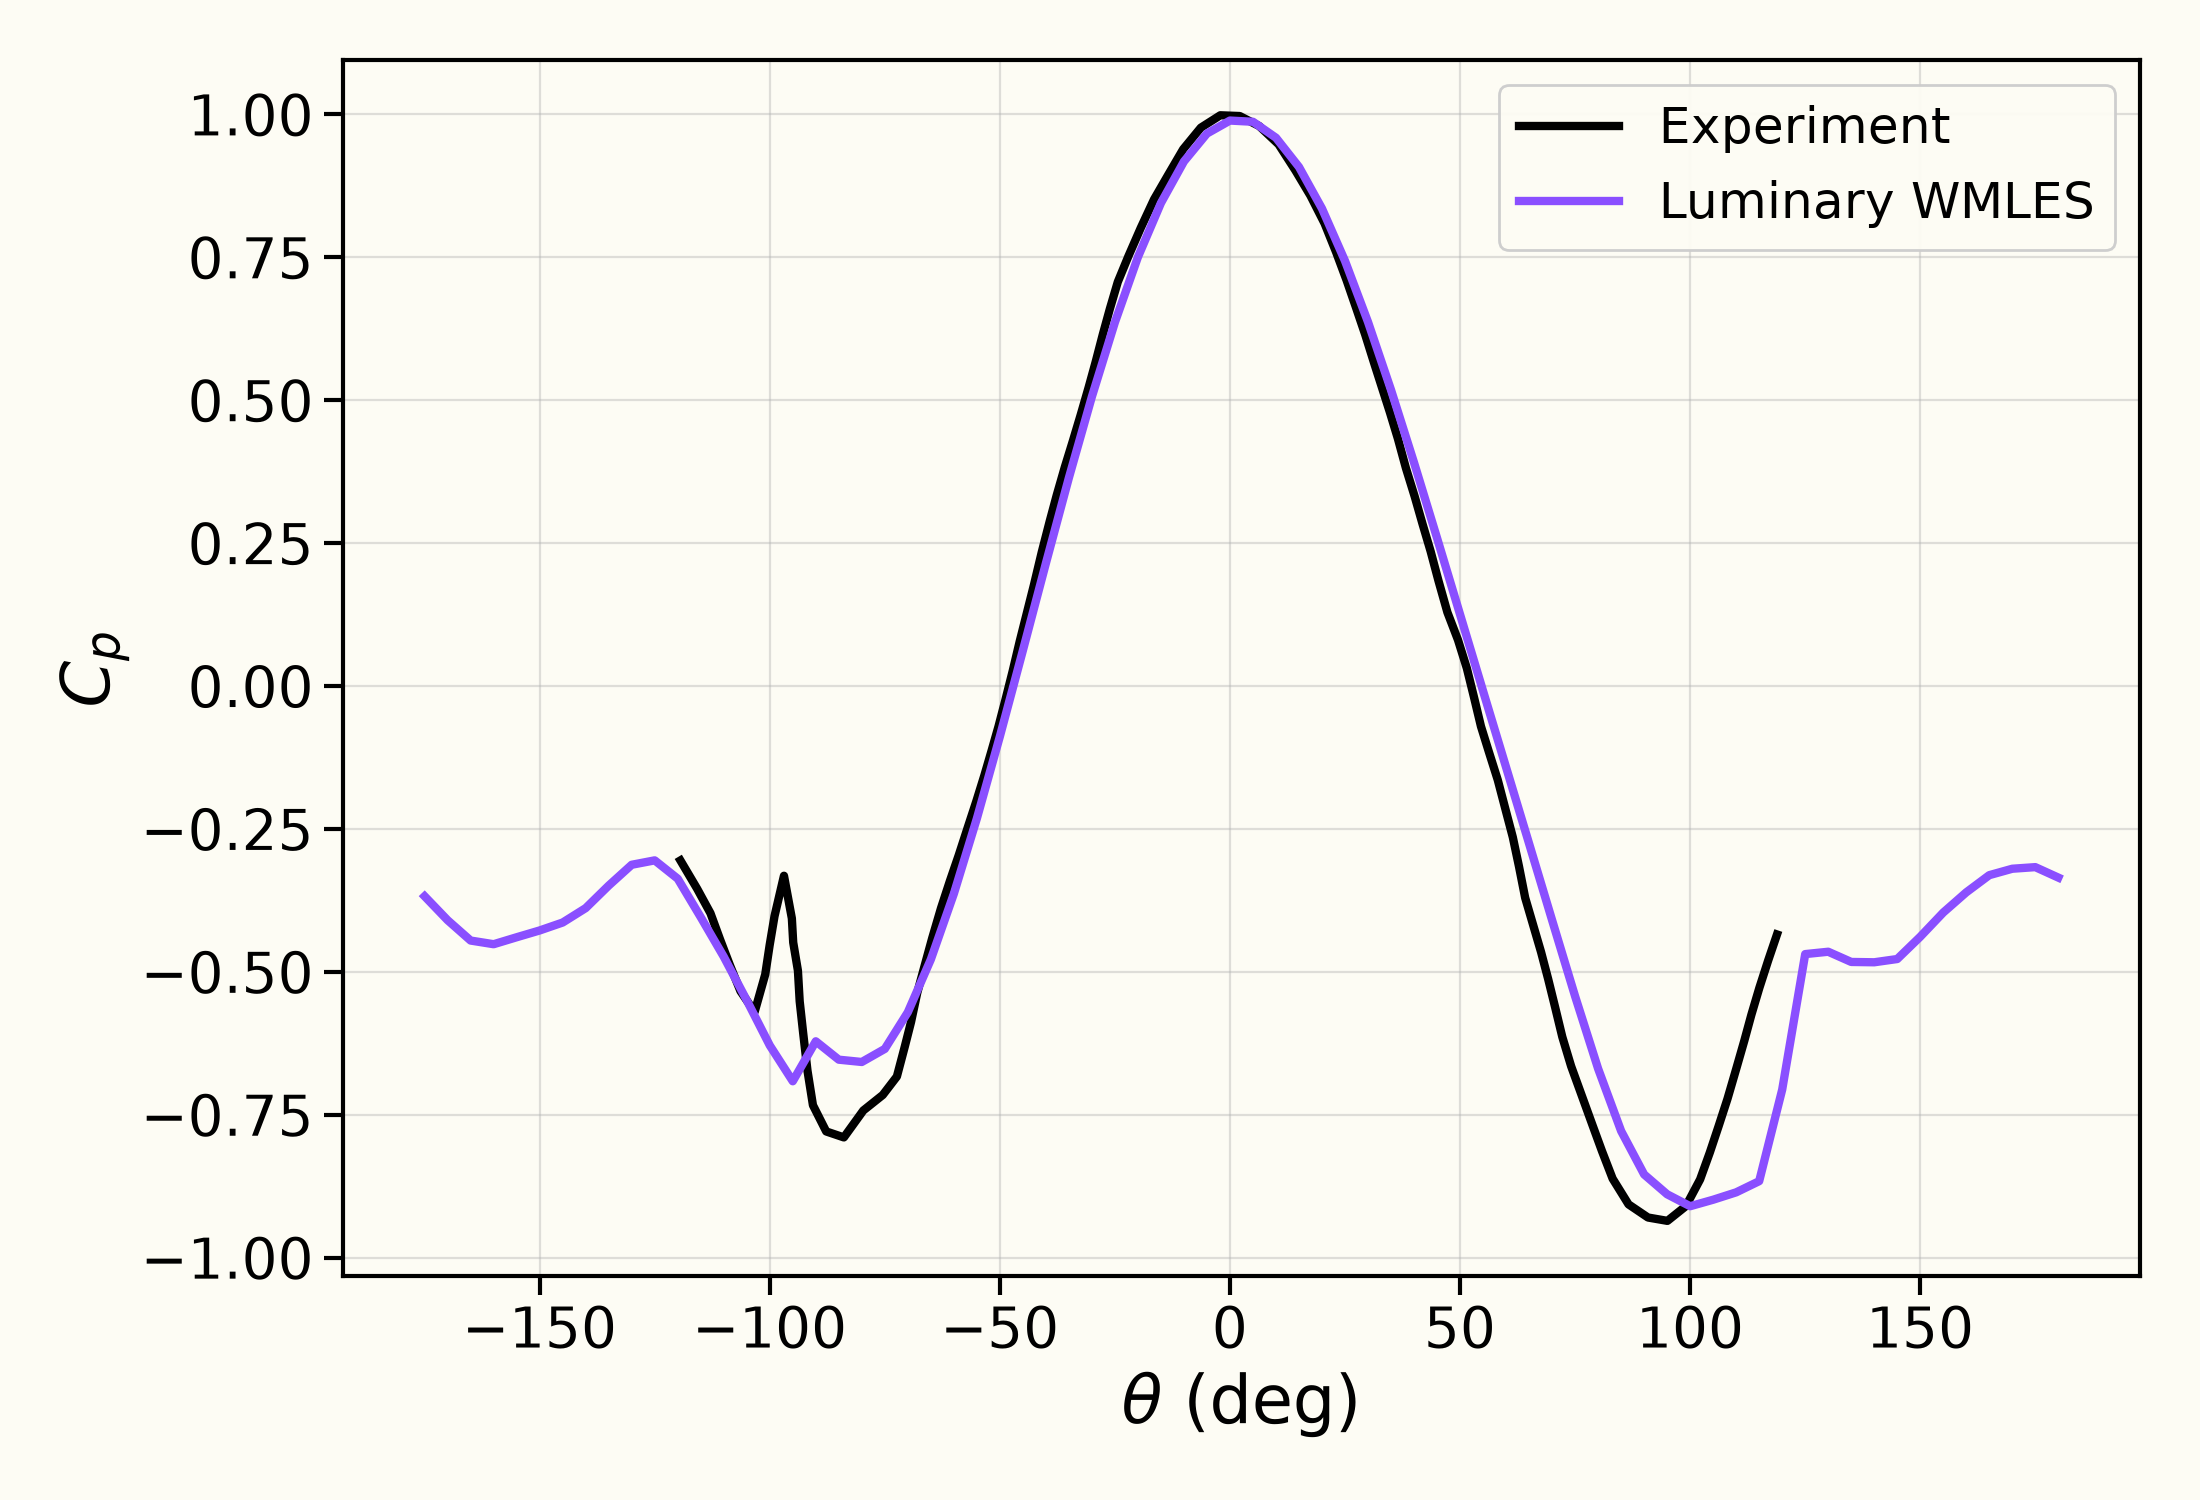
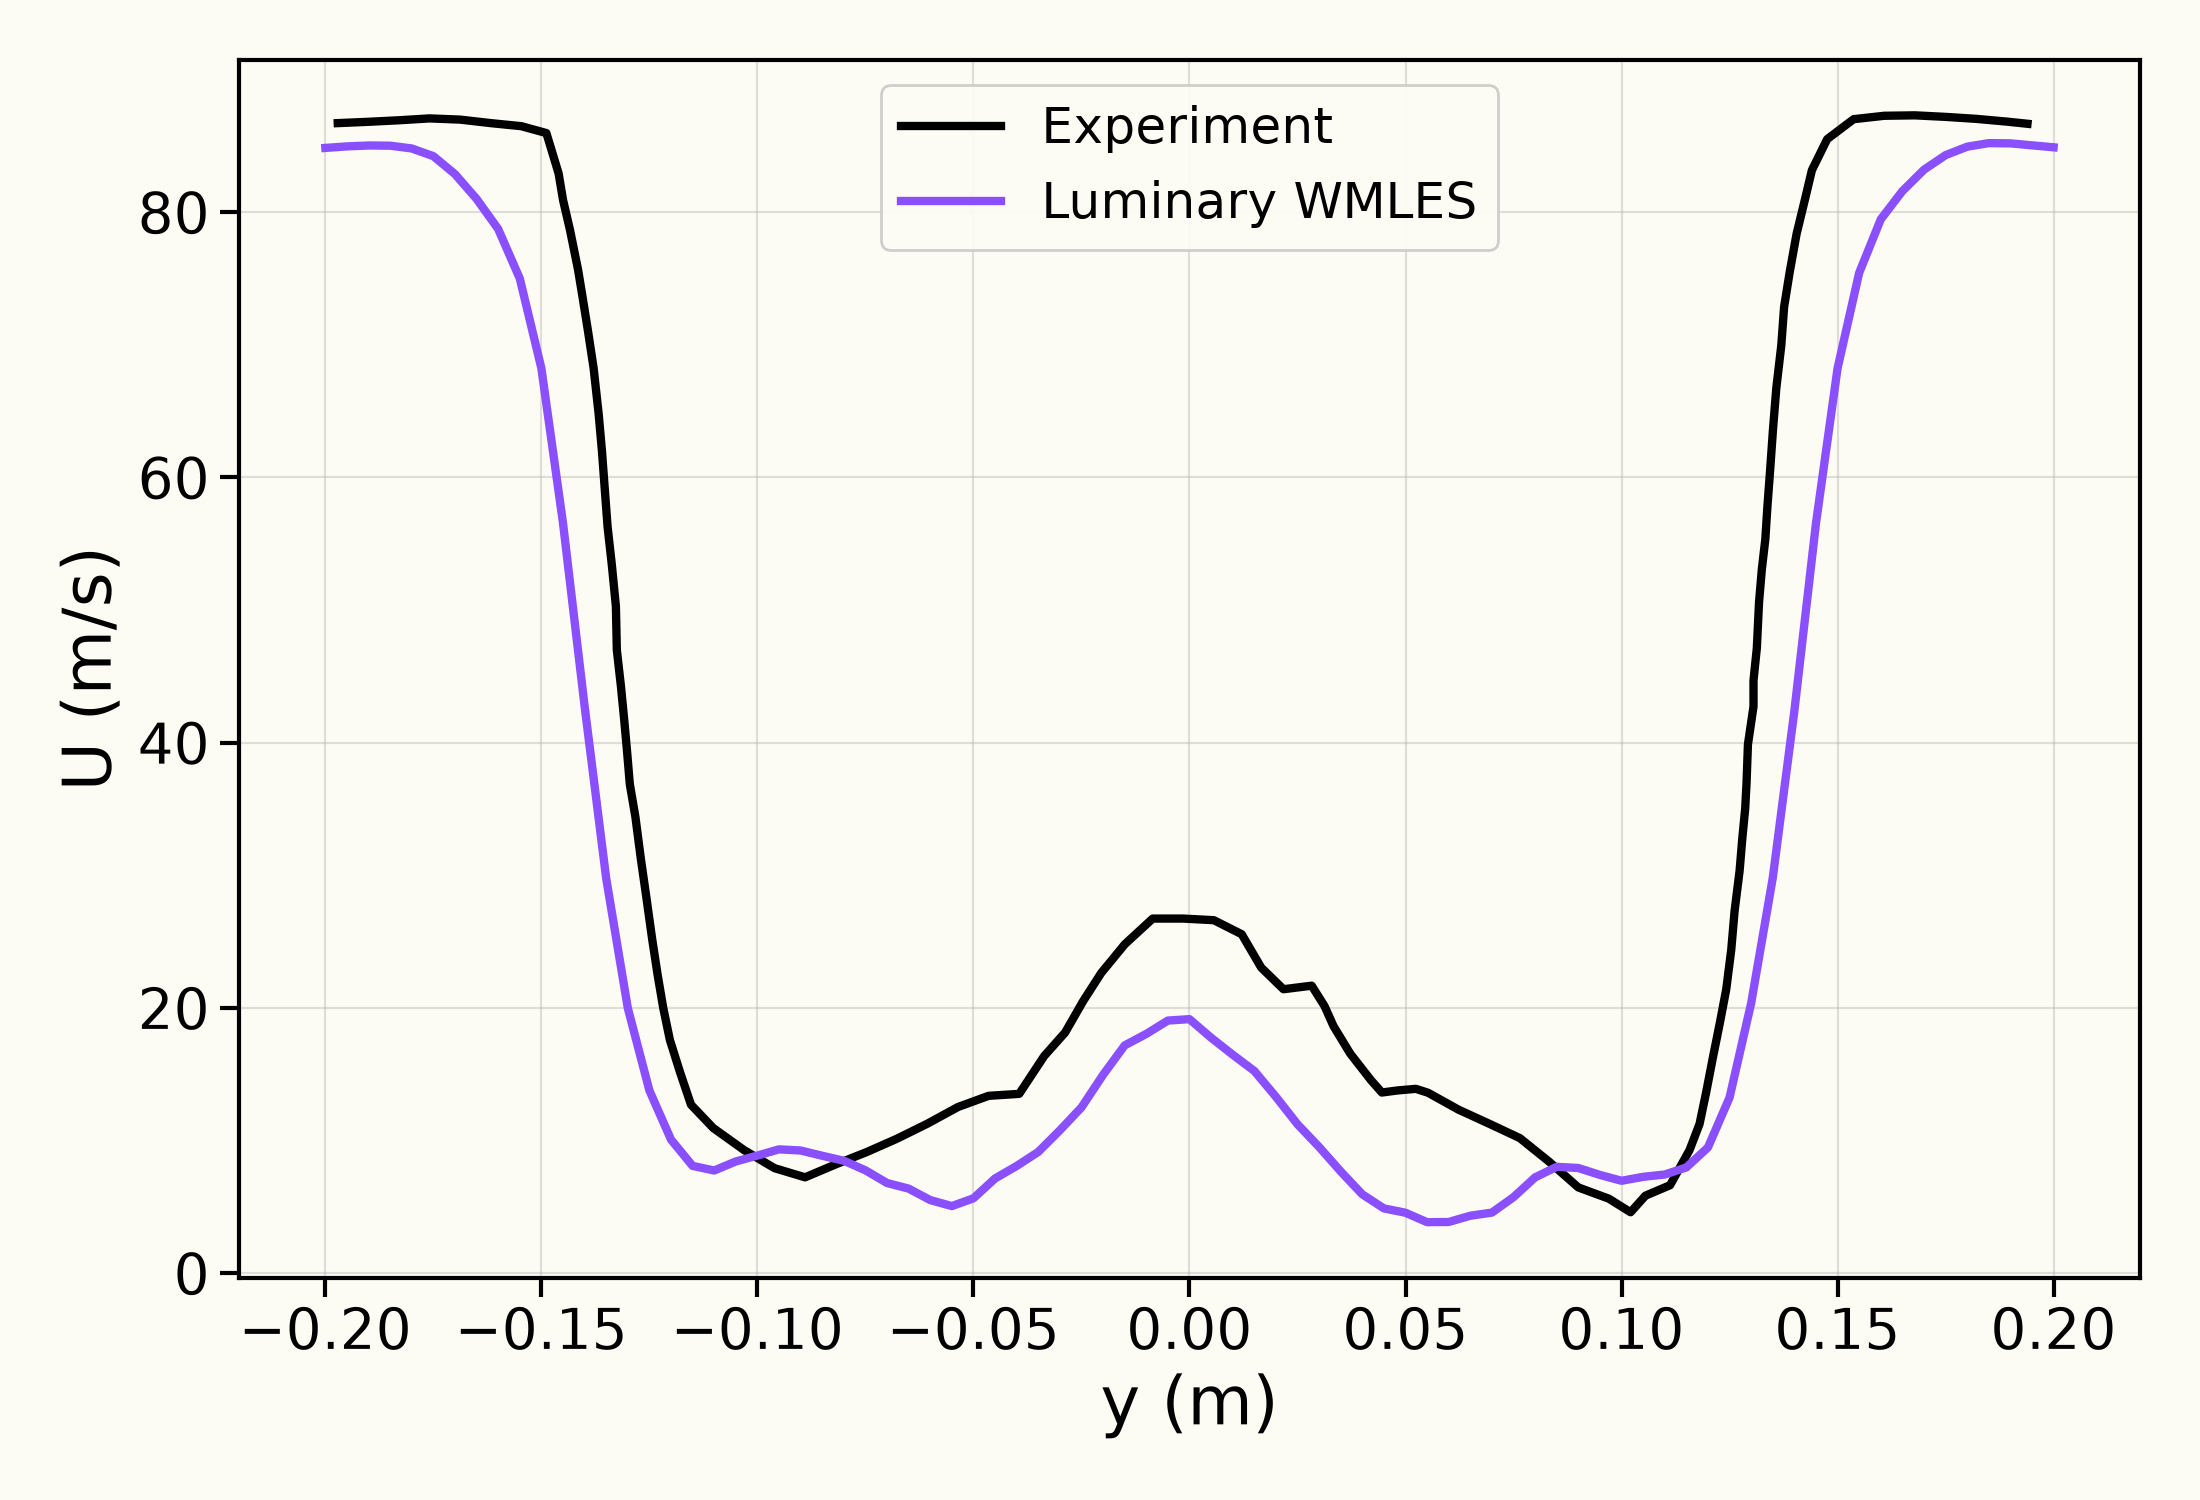
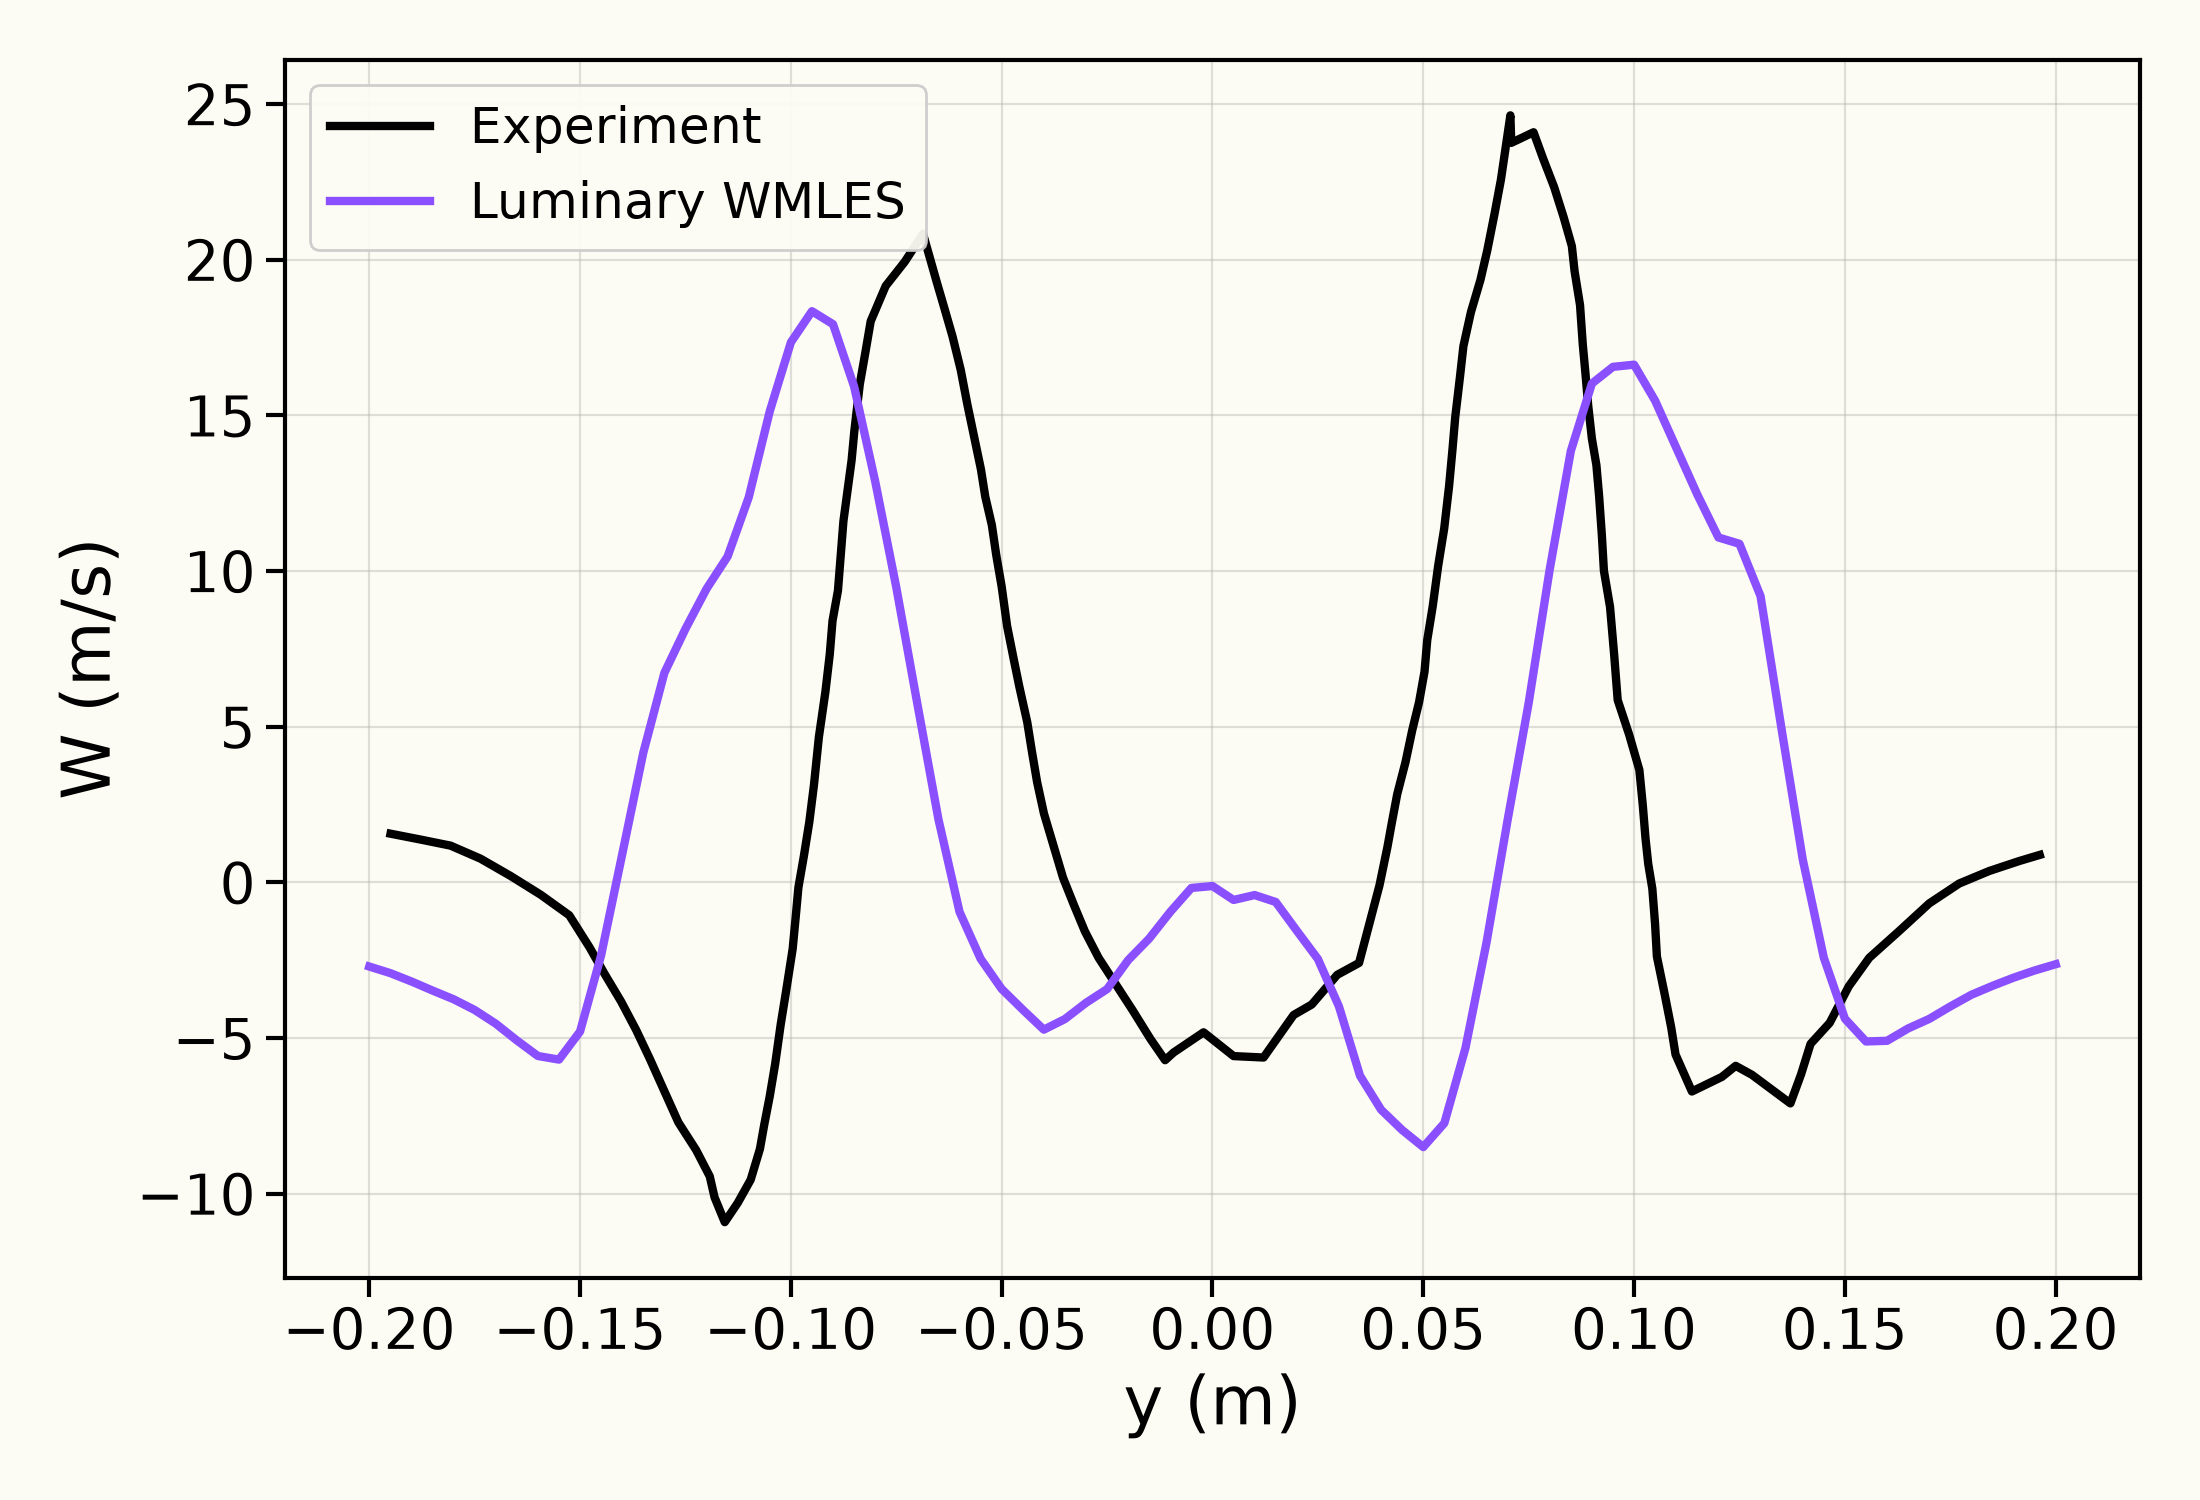
The flow around the gear comes first. The mean pressure follows the measurement over the front of the wheel. Behind the wheels the computed wake has the measured shape: a velocity deficit behind each wheel with faster flow between them, and the two upward peaks of the vertical velocity, with the computed wake slightly wider than the measured one.
The wall-pressure spectra at the kulite taps come straight from the flow solution. At each tap they follow the measurement from about Hz up to between and kHz depending on the tap, including the tones near kHz and kHz at K15. At K9 and K19 they are also close to the wall-modelled large-eddy simulation of Molina (2021).
At the far-field observers m away, both flyover and sideline, the Ffowcs Williams-Hawkings (FW-H) prediction from the gear wall follows the level and shape of the measured spectrum between about Hz and kHz, a few decibels above it around Hz. At the flyover observer it lies close to the simulation of Molina (2021), which shows the same rise around Hz. The permeable surface, which also takes in sound made in the wake around the gear, is a few decibels louder than the gear wall over most of this band.
Above a few kilohertz the computed spectra, like those of Molina (2021), fall below the measurement. The smallest eddies and the shortest sound waves a simulation can represent are a few grid cells across, so the mesh sets the highest frequency it resolves.
Solver configuration
- features exercised
- Validation3DDES/LESIdeal gasUnsteadyEnergy equationFW-H (solid / permeable surface)