
NASA CRM: AIAA Drag Prediction Workshop 6
Flagship benchmark showcase
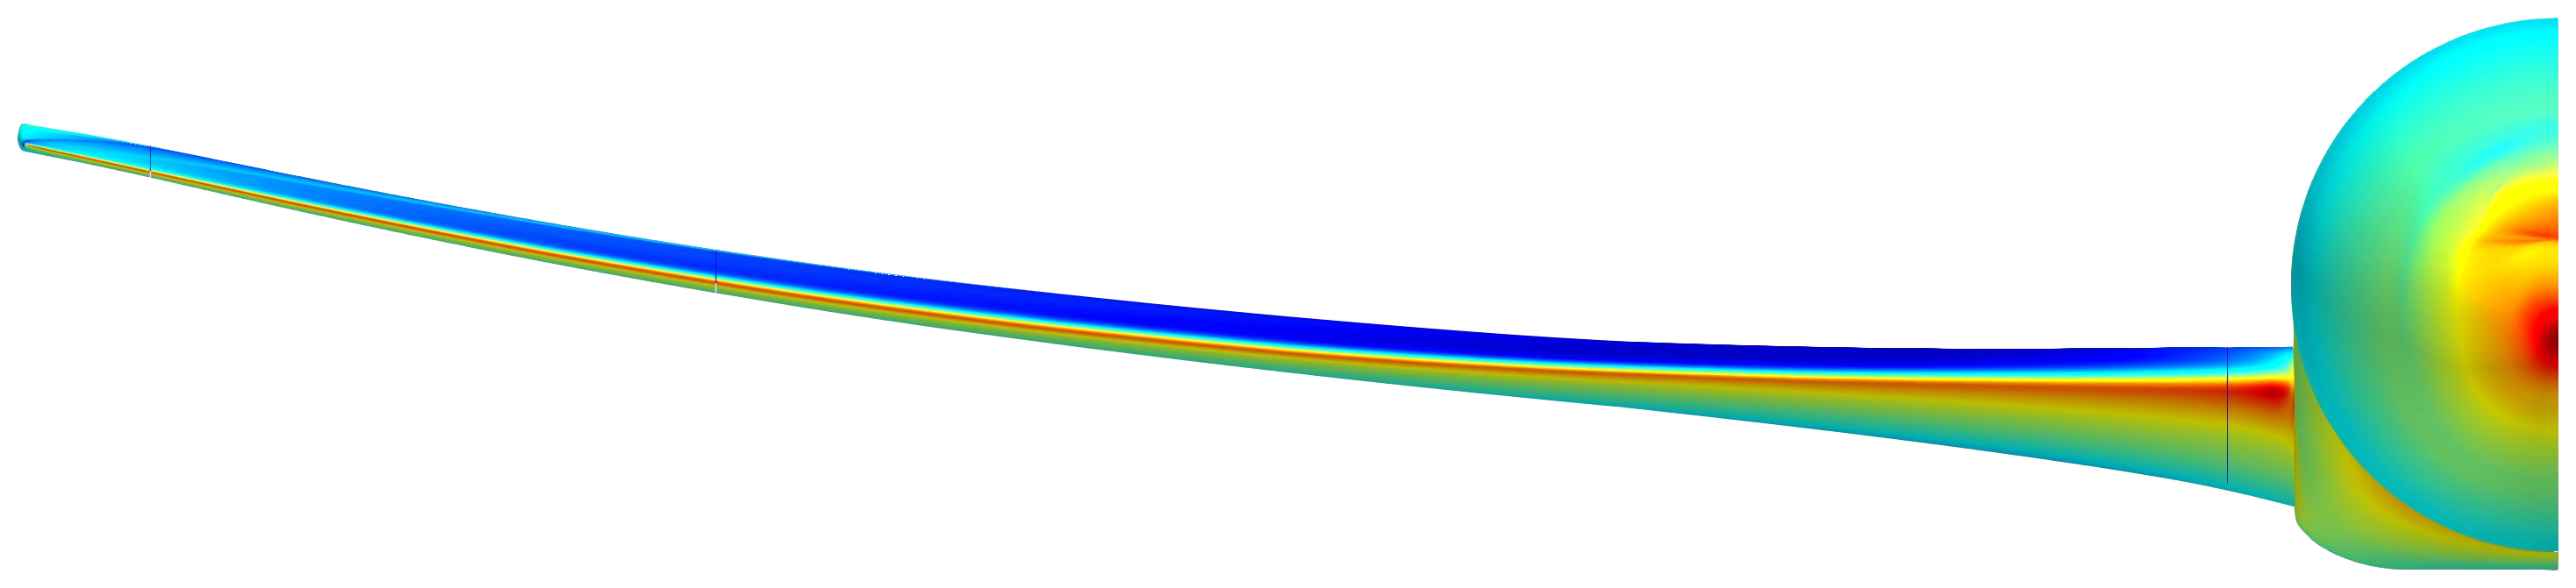
Overview
The NASA Common Research Model (CRM) is a transonic transport configuration that serves as the reference geometry for the AIAA CFD Drag Prediction Workshop series. The workshops compare computed forces and surface pressures against wind-tunnel measurements across many independent solvers. The sixth workshop (DPW-6, 2016) addressed the CRM Wing-Body at its transonic cruise design point.
This is a flagship validation benchmark. Luminary entered the workshop case, and the results reproduced here are taken from that published case study. Two turbulence models, the Spalart–Allmaras Standard model and Menter's SST-2003m model, are run at the same conditions, and the surface pressure distributions are compared against the NASA wind-tunnel data. The figures and force coefficients on this page are taken from the published case study; they are not recomputed in this repository.
Problem Setup
The geometry is the CRM Wing-Body. The flow is compressible (ideal-gas air) at a free-stream Mach number of and a chord Reynolds number of ; the incidence is trimmed so that the lift coefficient is held at the workshop design value . No-slip adiabatic walls are imposed on the aircraft surfaces and a Riemann far field on the outer boundary.
The mesh has roughly 71 million control volumes, with the first cell off the wall sized so that over the wing and fuselage surfaces (a low-Reynolds-number wall-resolved mesh without wall functions). The two turbulence models, the Spalart–Allmaras Standard model and Menter's SST-2003m model, are run at these same conditions.
Quantities of Interest
The validation quantities are the surface pressure coefficient at three spanwise stations and the integrated force coefficients at the fixed : the total drag and its pressure-drag component .
The pressure distributions are reported at three semi-span stations, , and (95%, 72.68% and 13.1% of the semi-span), shown left to right. At each station the distributions from both turbulence models are overlaid on the NASA wind-tunnel measurements, so the chordwise loading on the upper and lower surfaces can be read directly across the span.
For the Spalart–Allmaras Standard model at , the integrated total drag is and the pressure-drag component is . The range reported by the DPW-6 participants is and .
Sources
Luminary's published DPW-6 NASA CRM Wing-Body case study: surface at three span stations and integrated // at , , .
Workshop test case definition, common grids and the NASA wind-tunnel reference data for the CRM Wing-Body at the cruise design point.
Results
These results are reproduced from Luminary's published workshop submission (see Sources).
Surface pressure at three span stations
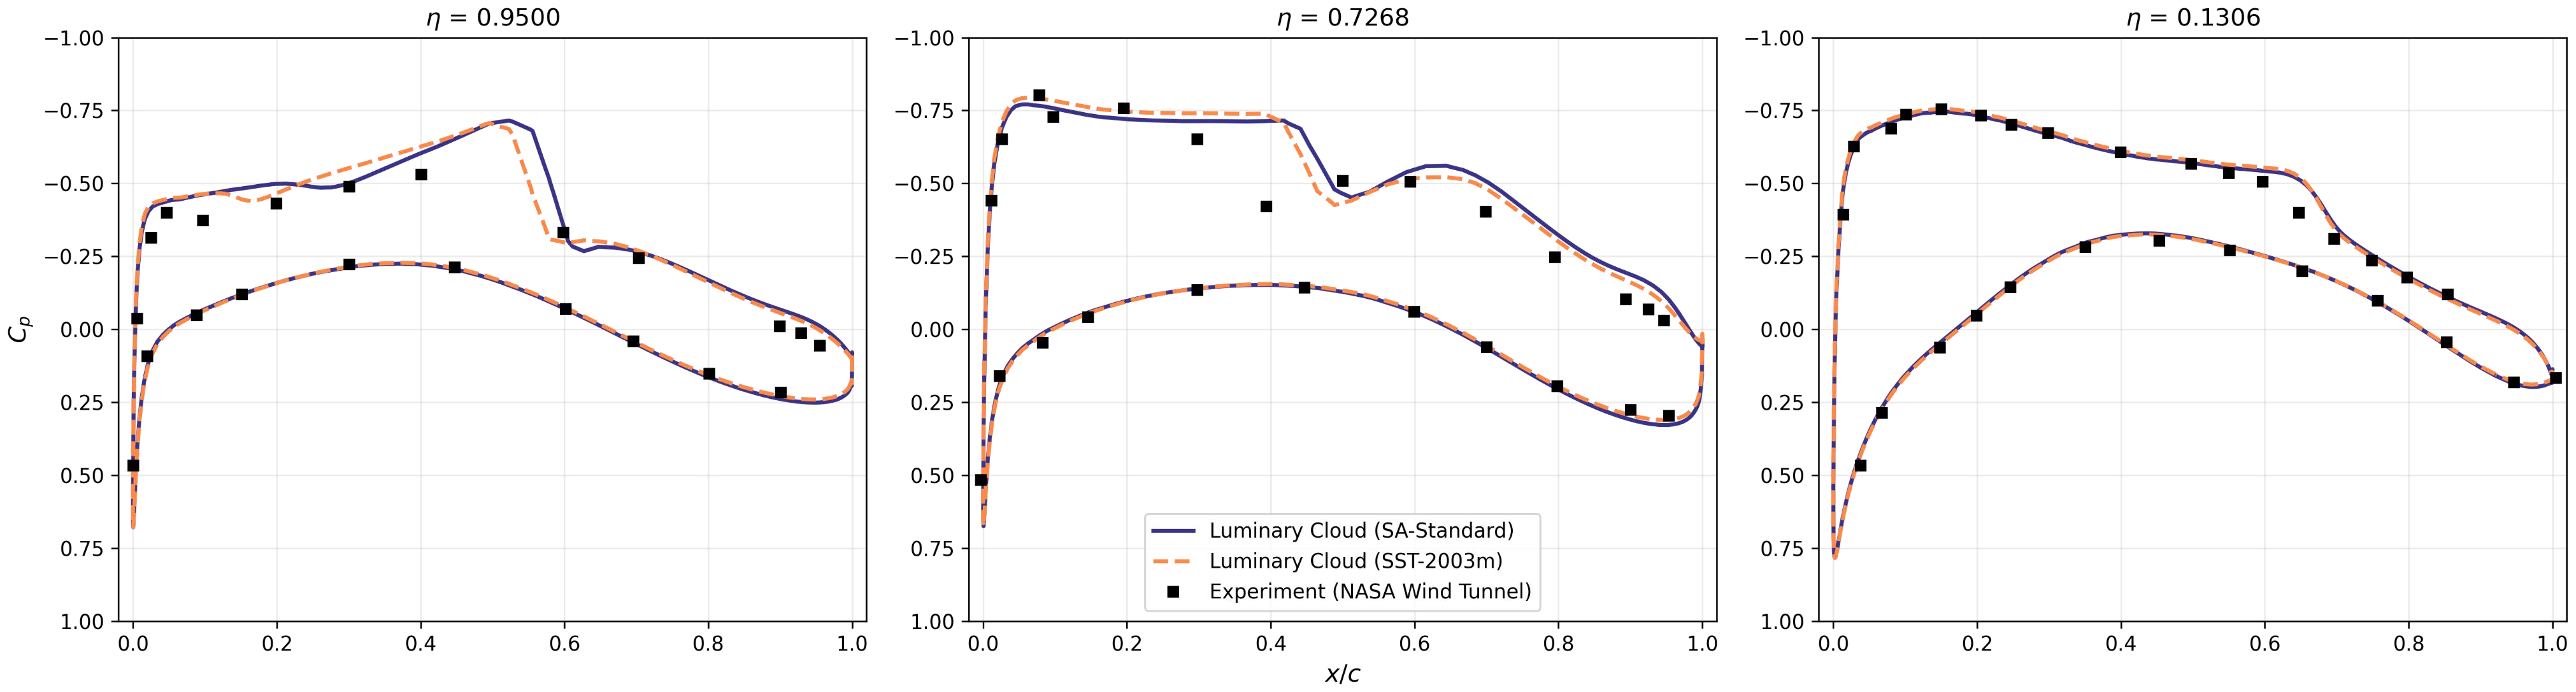
Reference: Luminary Cloud, "NASA CRM: Drag Prediction Workshop 6 (2016)": case study (SA Standard and SST-2003m vs. NASA wind-tunnel data). (surface at 13.1%, 72.68% and 95% semi-span): https://luminarycloud.com
Integrated force coefficients at
| CFD solver | |||
|---|---|---|---|
| Luminary (SA) | 0.5 | 0.0258 | 0.0143 |
| DPW-6 participants | 0.5 | 0.0254–0.0263 | 0.0140–0.0152 |
Integrated coefficients at the fixed cruise point, against the range reported by DPW-6 participants.
Reference: Luminary Cloud, "NASA CRM: Drag Prediction Workshop 6 (2016)": case study (SA Standard and SST-2003m vs. NASA wind-tunnel data). (integrated force coefficients at ): https://luminarycloud.com
Solver configuration
- features exercised
- VerificationValidation3DRANSSpalart–Allmarask–ω SSTIdeal gasSteadyEnergy equation