
Cylinder at Re = 10⁴: FW-H Against Literature
verification
Animation of the divergence of the velocity (the dilatation) on a plane through the cylinder, which shows the sound radiated by the turbulent wake, with isosurfaces of the vortical structures coloured by the velocity magnitude in m/s.
Overview
A circular cylinder at a Reynolds number of sheds a turbulent wake that radiates sound at the shedding frequency. This case simulates the flow with a large-eddy simulation and predicts the far-field sound with the Ffowcs Williams-Hawkings analogy, evaluated on the cylinder wall and on a permeable surface around the cylinder in the same flow solution. The wake statistics, the far-field spectra and the directivity are compared with Khalighi et al. (2010).
Problem Setup
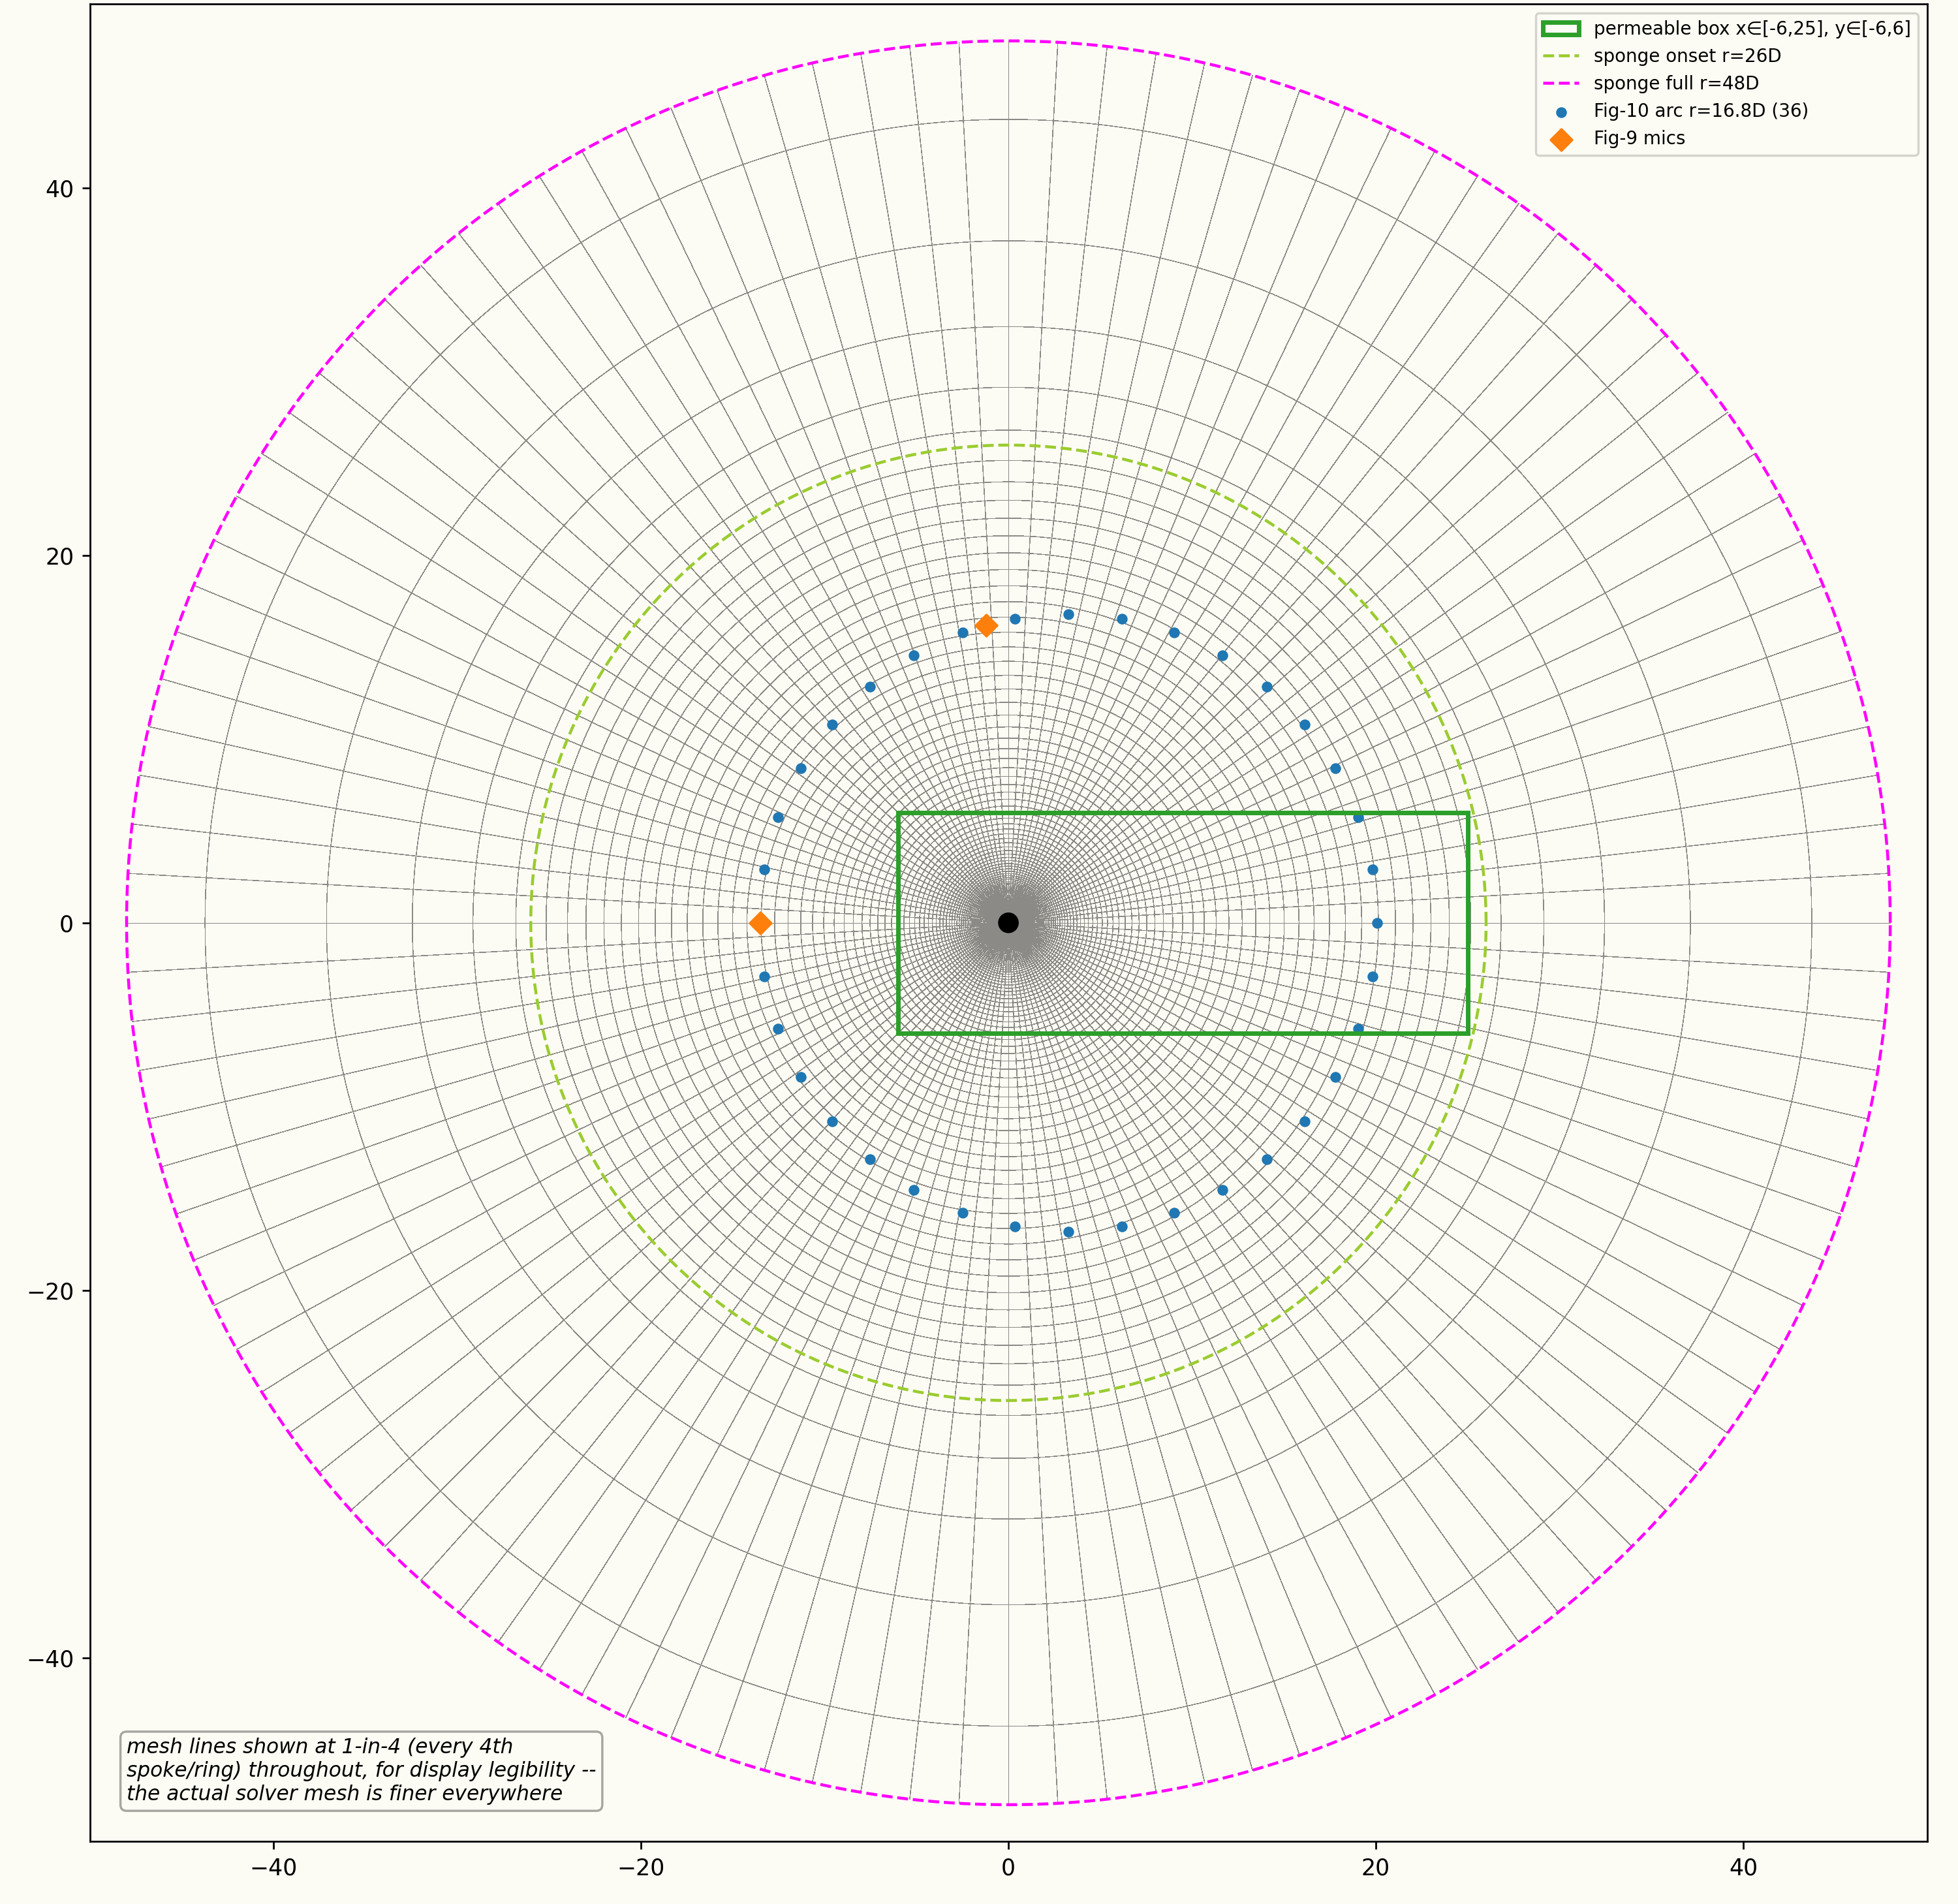
The flow is at ( m/s, K, Pa) with a constant dynamic viscosity chosen so that for a cylinder of diameter . The O-grid is deep and periodic in the spanwise direction, and a sponge layer that absorbs the outgoing sound starts at and is thick. The large-eddy simulation uses the WALE subgrid-scale model and the FDS convective flux with its hybrid low-dissipation formulation, with second-order implicit time integration and s.
Starting from a fully developed flow, the statistics and the acoustic record are collected over 86,368 time steps. The acoustic pressure is recorded at 38 observers at mid-span: a ring of 36, apart, of radius about , and the two microphones of the reference at and . The permeable surface is the box , over the full span, open on its spanwise faces and on its downstream face. Both Ffowcs Williams-Hawkings integrals are repeated over 25 copies of the span to represent a long cylinder.
Quantities of Interest
The mean and RMS streamwise velocity and the Lighthill-stress spectra in the wake, the far-field pressure spectra at the two microphones, and the level of the sound at the shedding frequency around the ring, from both integration surfaces, each compared with Khalighi et al. (2010).
Sources
Results
Mesh and domain
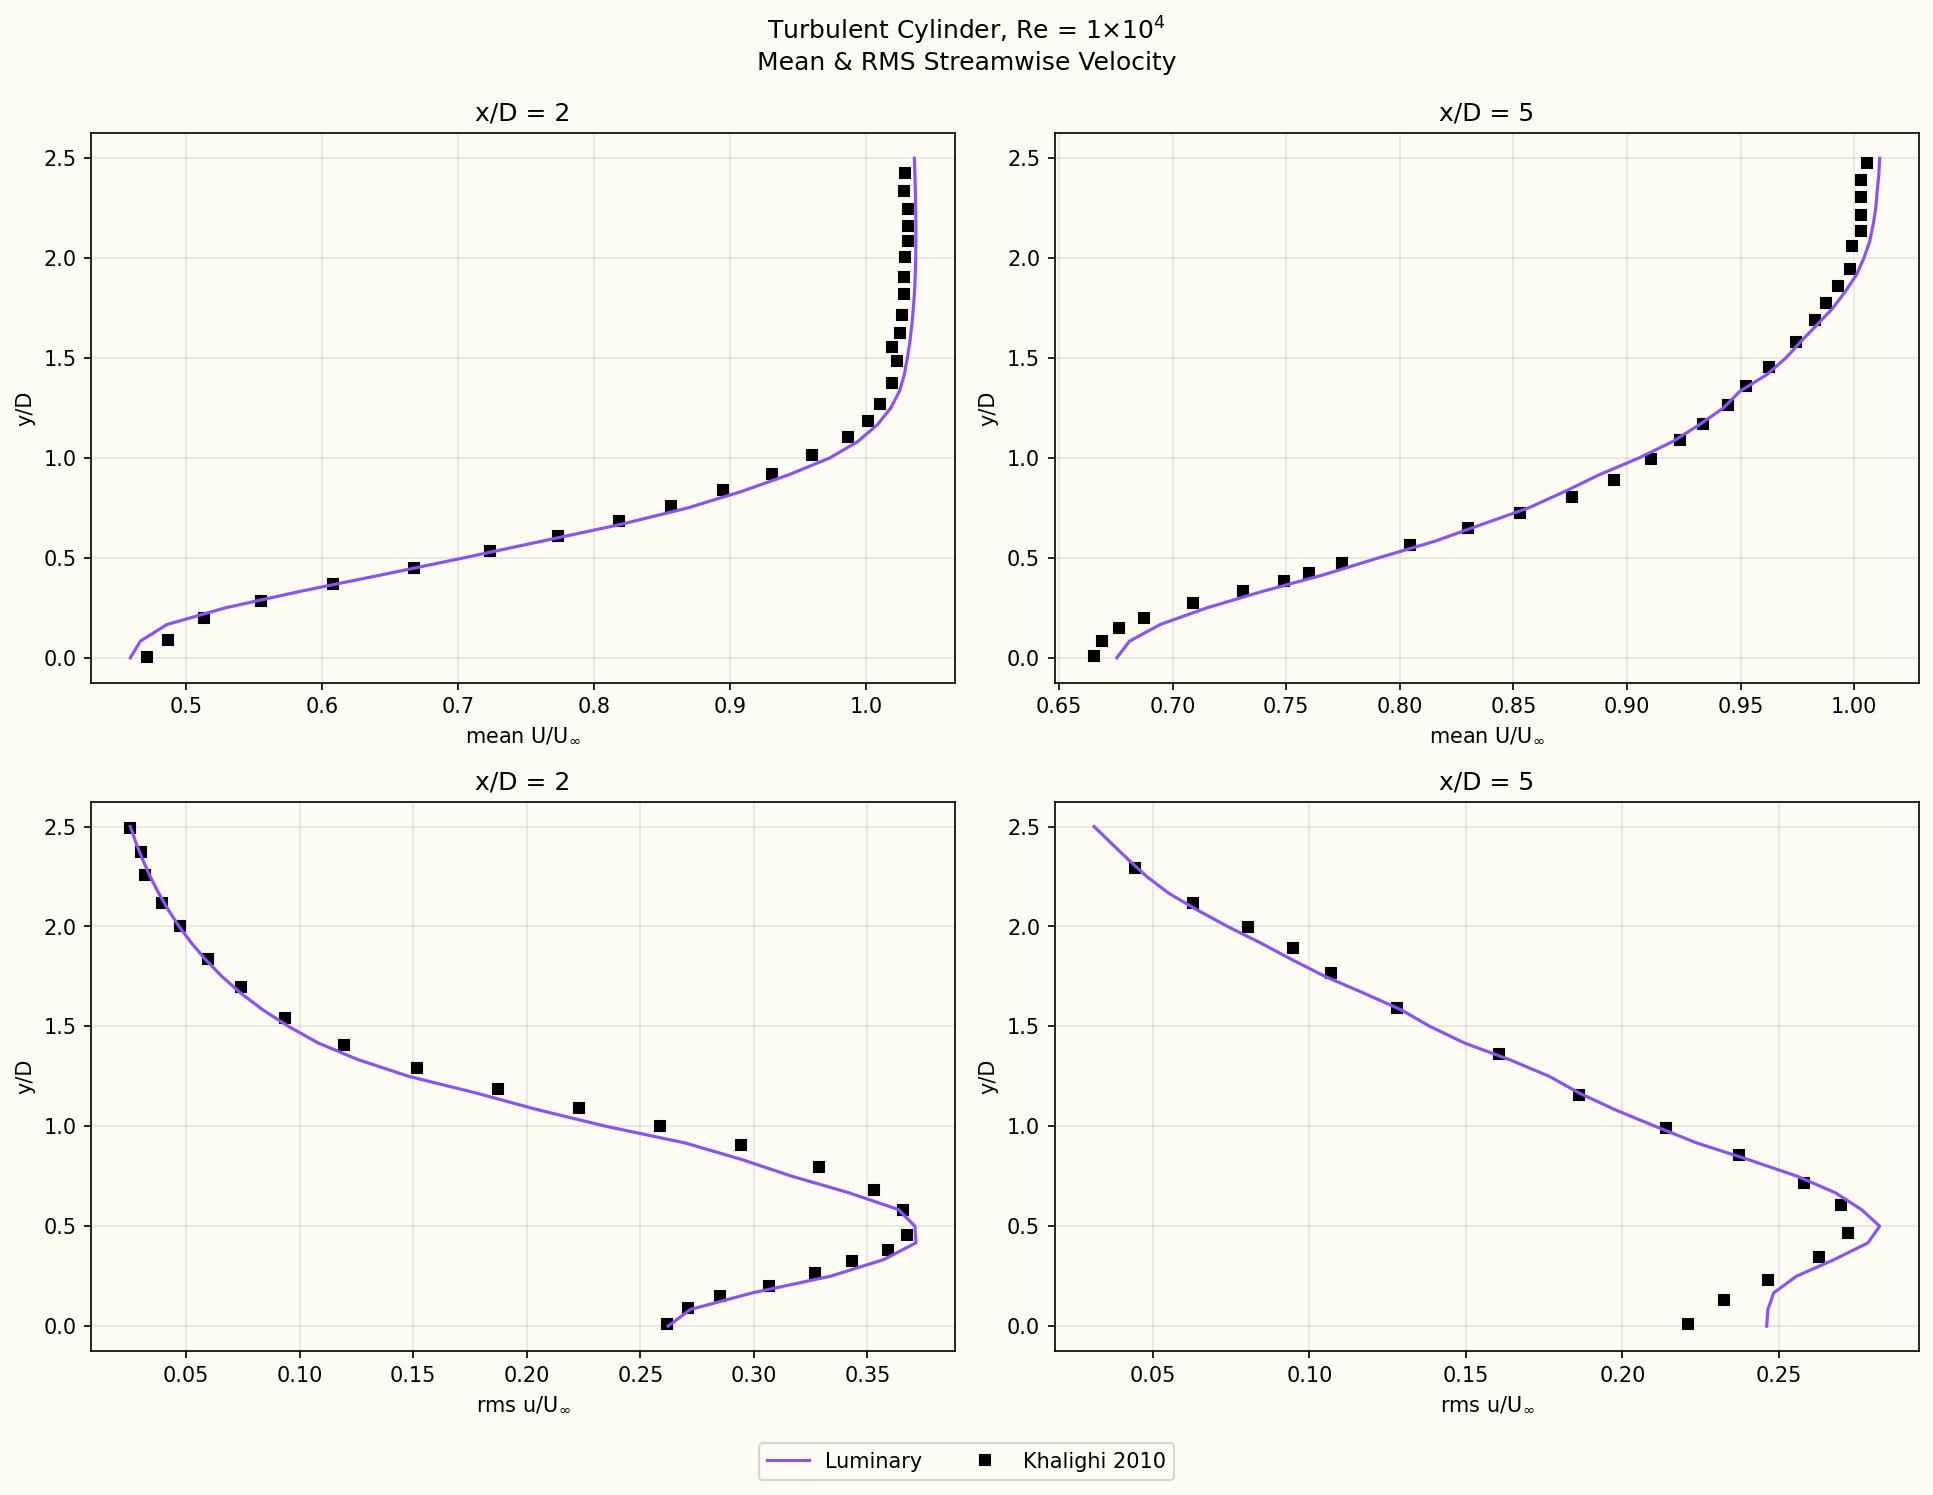
Velocity profiles in the wake
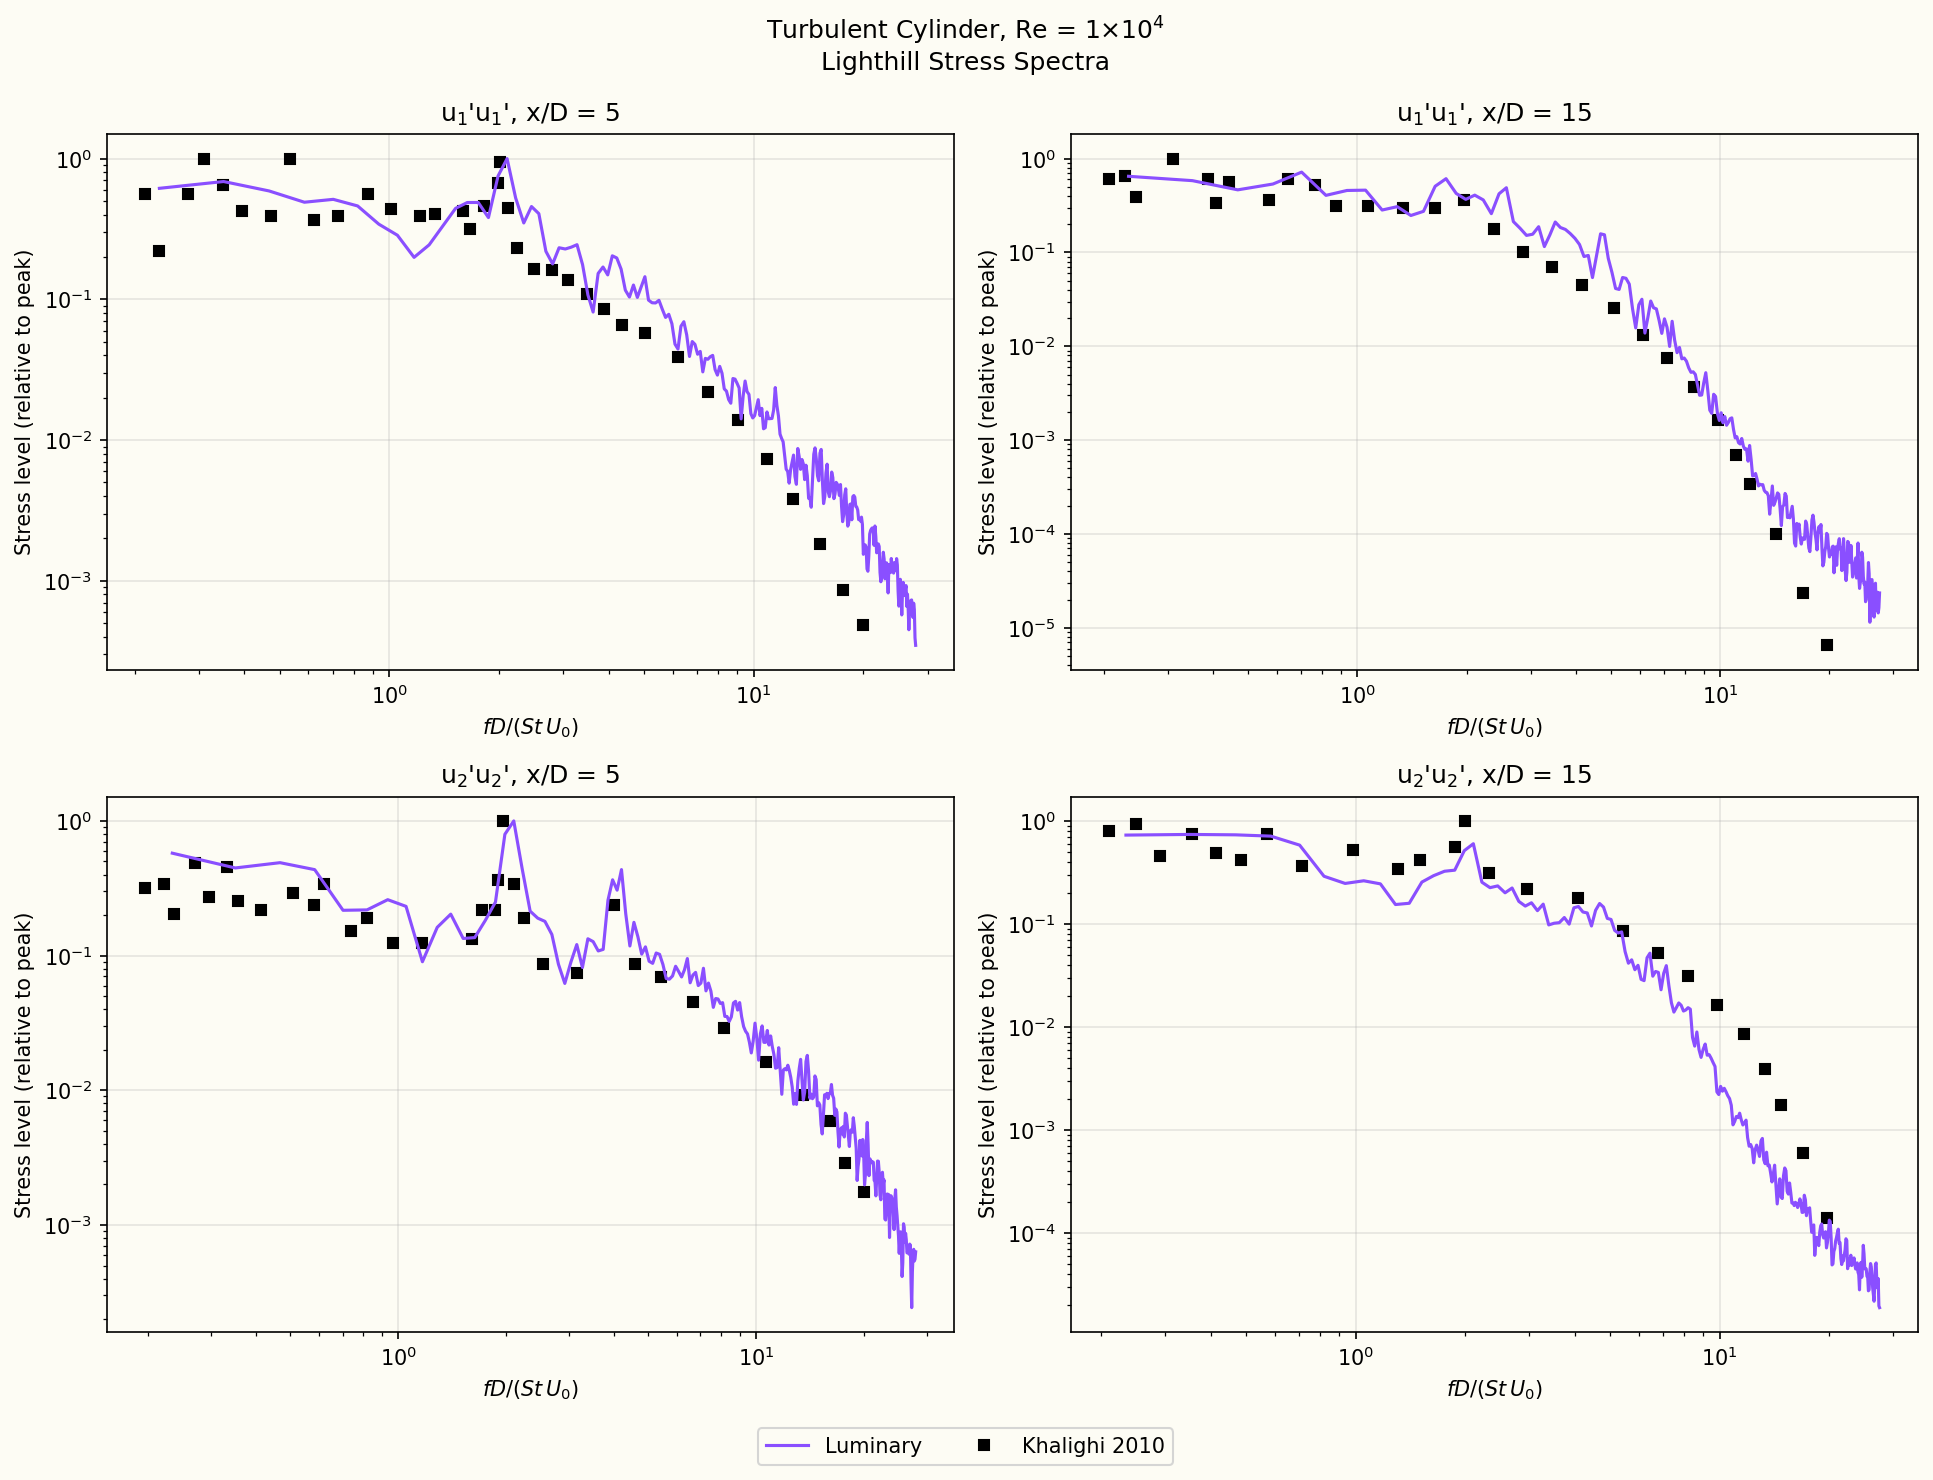
Lighthill stress spectra
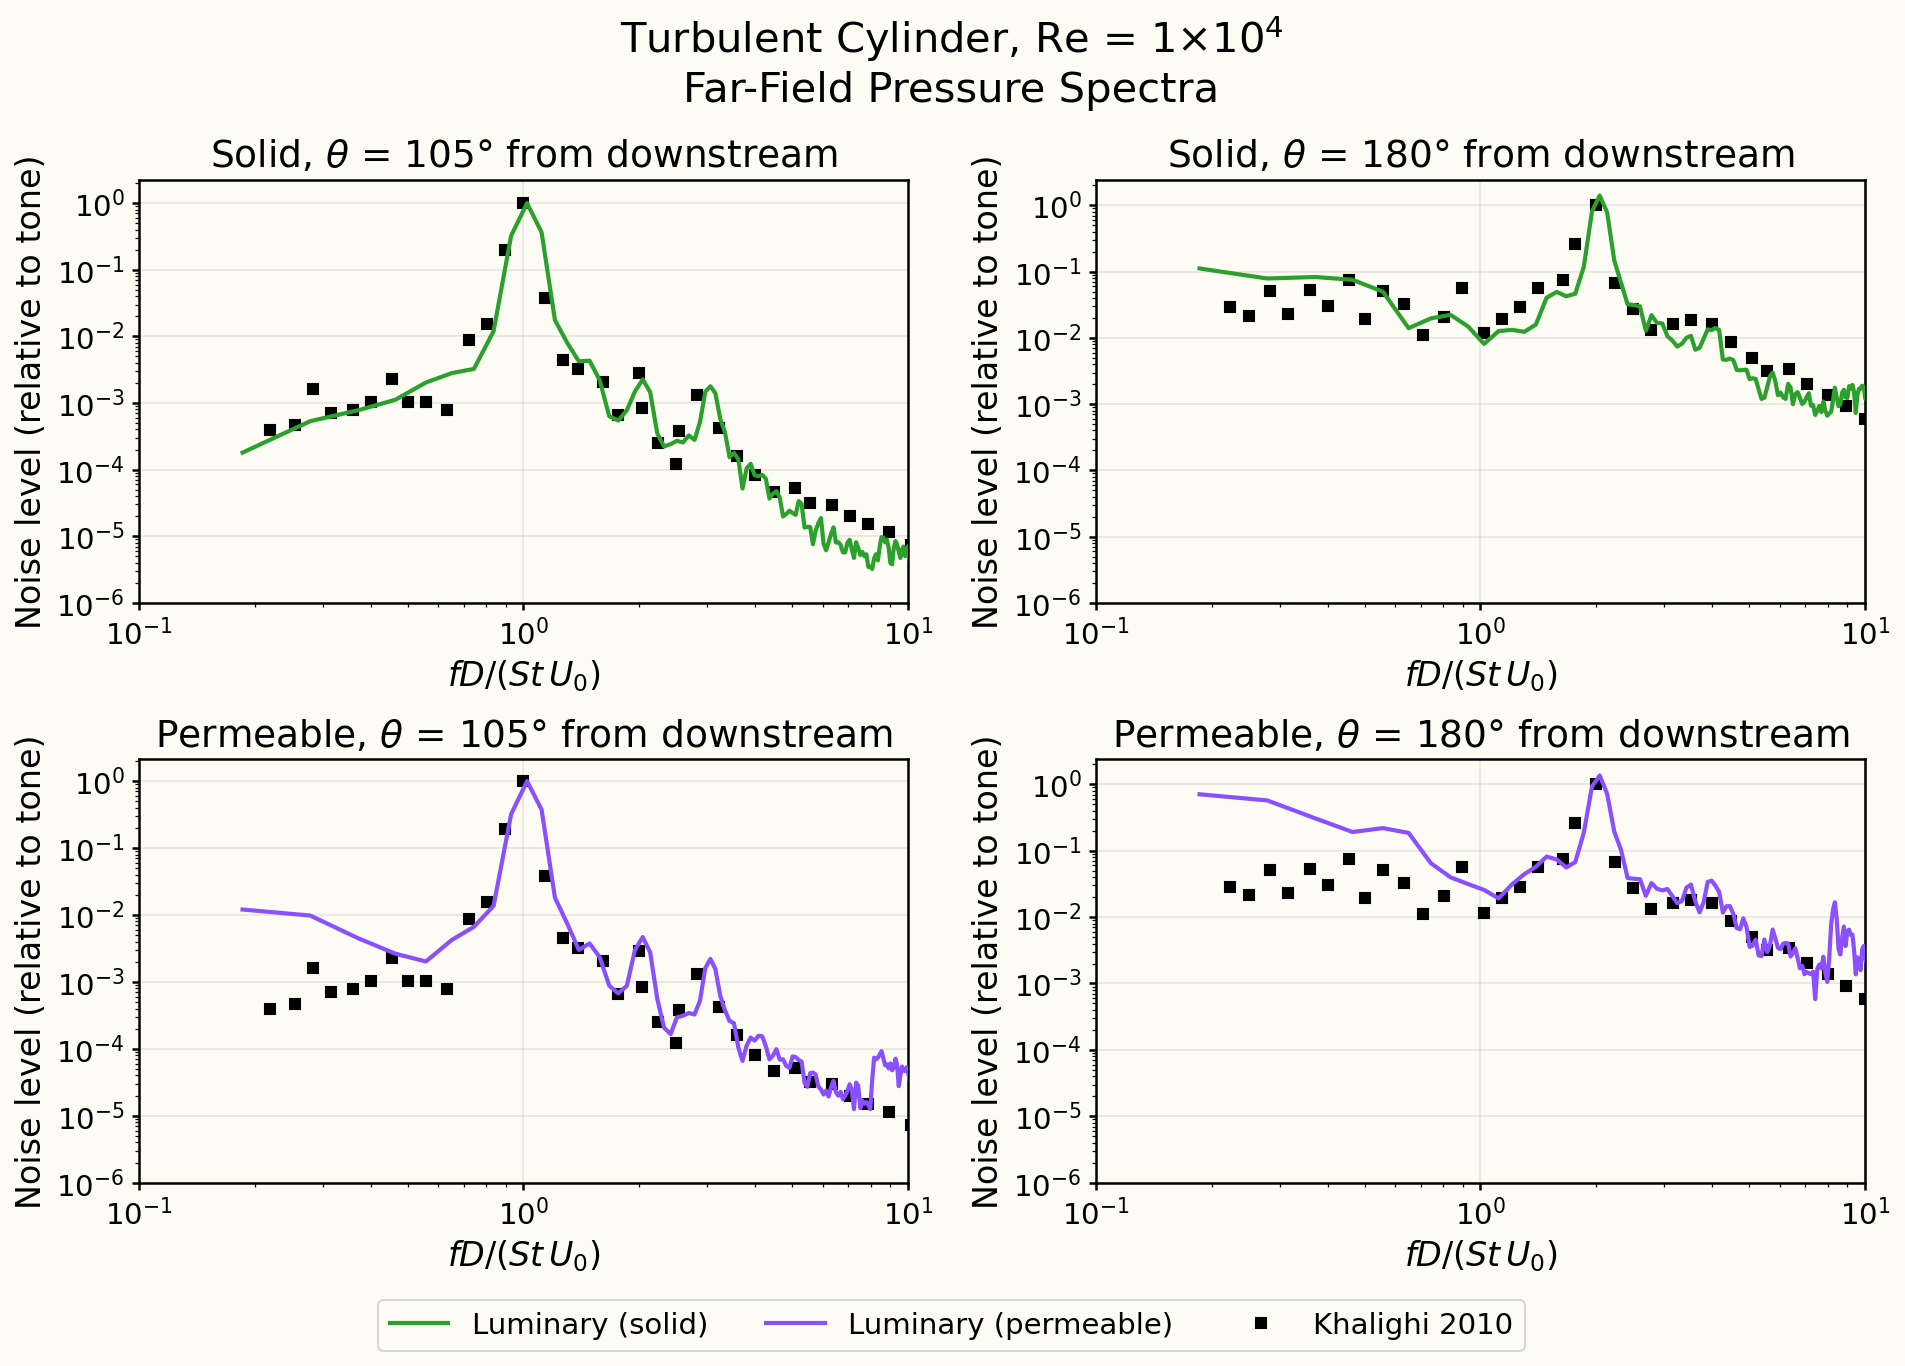
Far-field pressure spectra
Far-field directivity at the shedding frequency
Discussion
At a Reynolds number of the wake is turbulent, so the sound is a peak at the shedding frequency on top of a broad hiss from the turbulence. The sound depends on the flow that makes it, so the page first compares the wake. The mean and RMS (root-mean-square, a measure of how strongly the velocity fluctuates) velocity profiles behind the cylinder follow Khalighi et al. at both stations, and the Lighthill-stress spectra, which describe the turbulent fluctuations that act as sound sources, peak at the same frequency as the reference with the same level at low frequency.
The far-field spectra are plotted against frequency divided by the shedding frequency, so the shedding tone is at 1, and each spectrum is scaled to its own tone. Above the cylinder ( from downstream) the strongest peak is at 1. This is the lift, which swings up and down once per shedding cycle. Directly upstream () the strongest peak is at 2. This is the drag, which pulses twice per cycle, once for each vortex. Both Ffowcs Williams-Hawkings (FW-H) surfaces reproduce these peaks, the smaller harmonics, and the fall of the spectrum at higher frequencies. The largest differences are at the lowest frequencies, well below the tone.
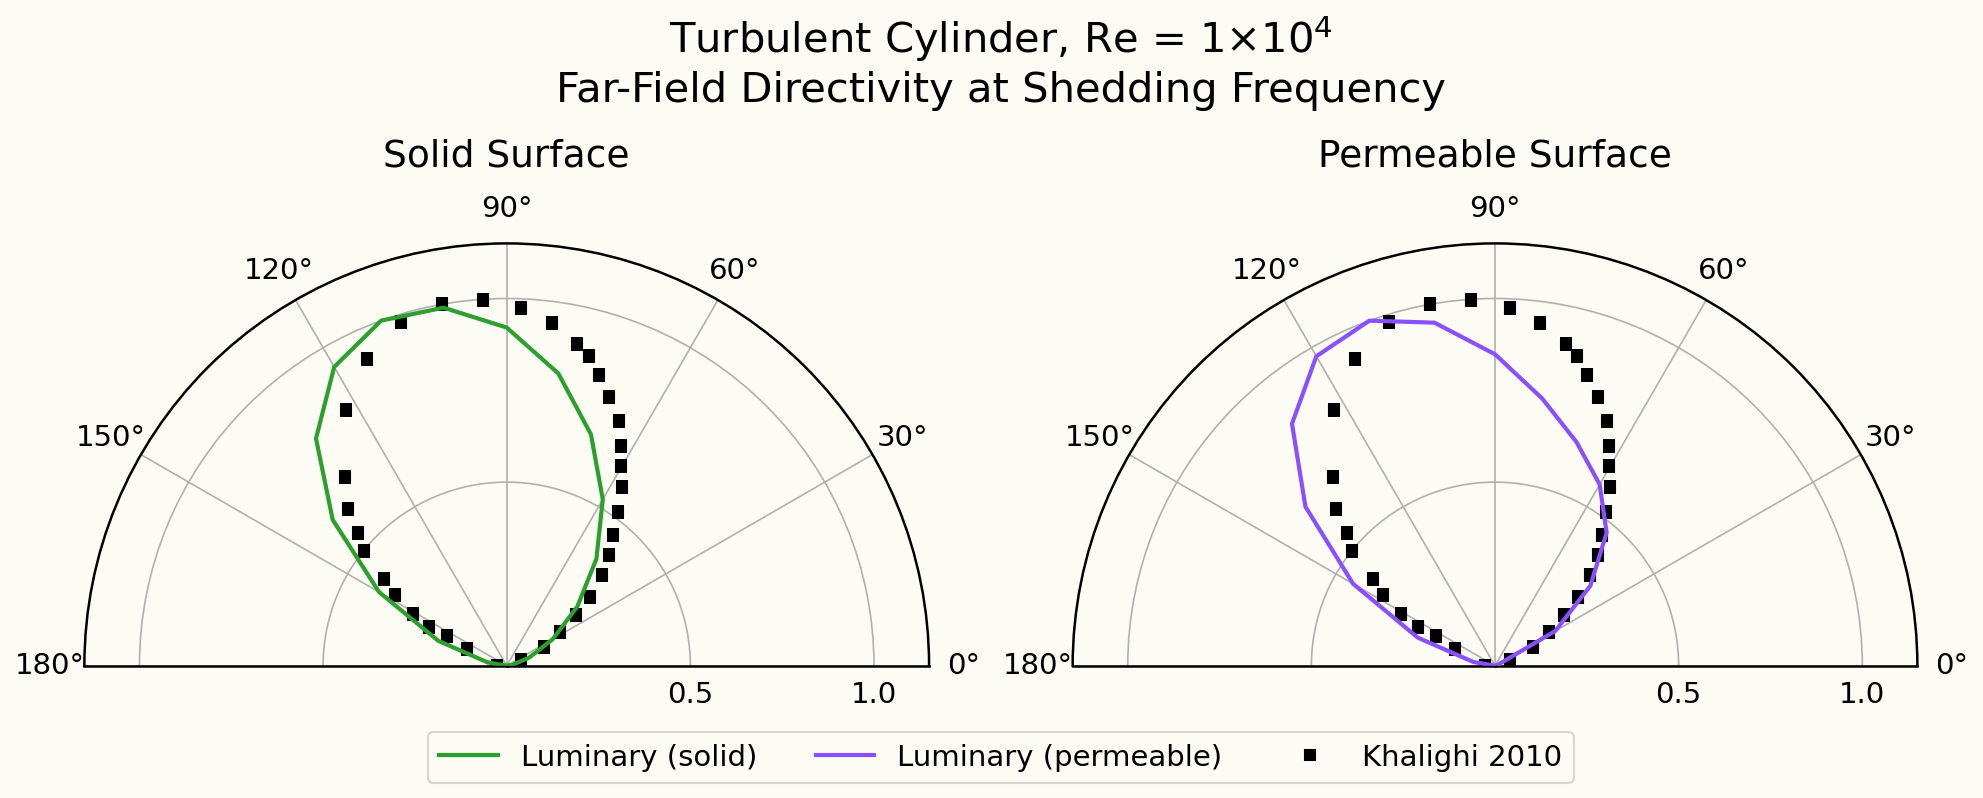
The directivity plot shows how the strength of the tone at the shedding frequency varies with direction, each curve scaled to its own maximum. Both surfaces give the single broad lobe of the reference, loud above the cylinder and quiet along the flow axis, with the computed lobe leaning further upstream.
Solver configuration
- features exercised
- Verification3DDES/LESIdeal gasUnsteadyEnergy equationFW-H (solid / permeable surface)